Most Americans say there’s too much economic inequality in the United States these days. To understand how people’s financial circumstances have changed in recent decades, we looked at trends in income and wealth for lower-, middle- and upper-income households since 2000.
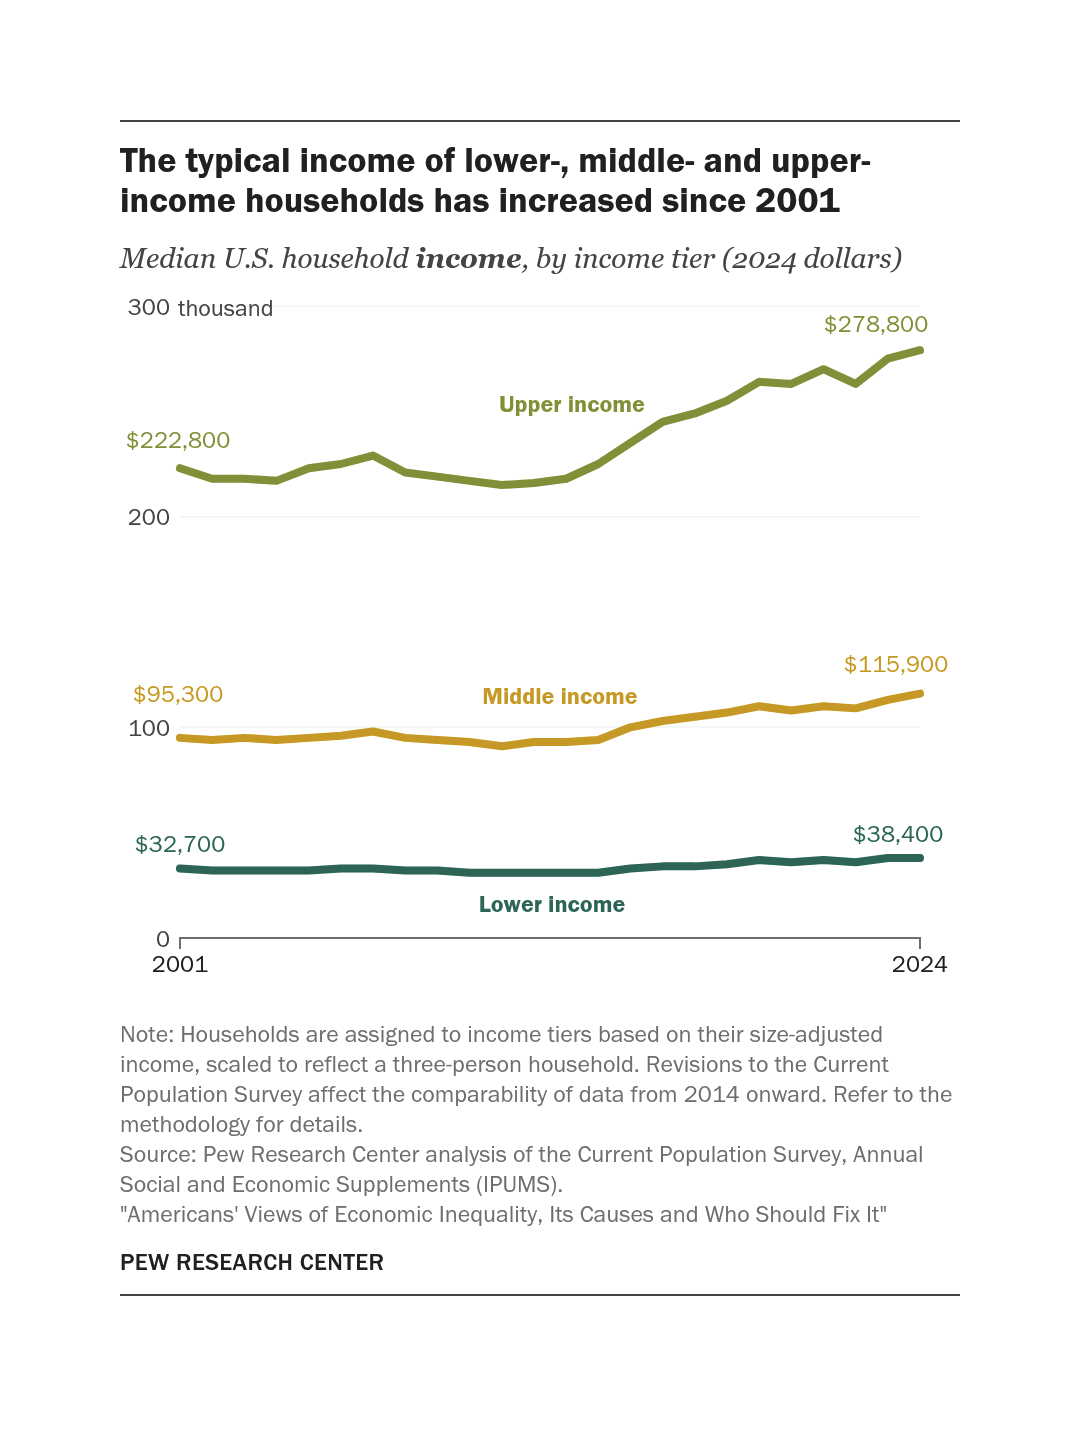
The typical income of lower-, middle- and upper-income households has increased since 2001
Median U.S. household income, by income tier (2024 dollars)
Note: Households are assigned to income tiers based on their size-adjusted income, scaled to reflect a three-person household. Revisions to the Current Population Survey affect the comparability of data from 2014 onward. Refer to the methodology for details.
Source: Pew Research Center analysis of the Current Population Survey, Annual Social and Economic Supplements (IPUMS).
“Americans’ Views of Economic Inequality, Its Causes and Who Should Fix It”
PEW RESEARCH CENTER
The typical income of lower-, middle- and upper-income households has increased since 2001
Median U.S. household income, by income tier (2024 dollars)
| Year | Lower income | Middle income | Upper income |
|---|---|---|---|
| 2001 | 33 | 95 | 223 |
| 2002 | 32 | 94 | 218 |
| 2003 | 32 | 95 | 218 |
| 2004 | 32 | 94 | 217 |
| 2005 | 32 | 95 | 223 |
| 2006 | 33 | 96 | 225 |
| 2007 | 33 | 98 | 229 |
| 2008 | 32 | 95 | 221 |
| 2009 | 32 | 94 | 219 |
| 2010 | 31 | 93 | 217 |
| 2011 | 31 | 91 | 215 |
| 2012 | 31 | 93 | 216 |
| 2013 | 31 | 93 | 218 |
| 2014 | 31 | 94 | 225 |
| 2015 | 33 | 100 | 235 |
| 2016 | 34 | 103 | 245 |
| 2017 | 34 | 105 | 249 |
| 2018 | 35 | 107 | 255 |
| 2019 | 37 | 110 | 264 |
| 2020 | 36 | 108 | 263 |
| 2021 | 37 | 110 | 270 |
| 2022 | 36 | 109 | 263 |
| 2023 | 38 | 113 | 275 |
| 2024 | 38 | 116 | 279 |
Note: Households are assigned to income tiers based on their size-adjusted income, scaled to reflect a three-person household. Revisions to the Current Population Survey affect the comparability of data from 2014 onward. Refer to the methodology for details.
Source: Pew Research Center analysis of the Current Population Survey, Annual Social and Economic Supplements (IPUMS).
“Americans’ Views of Economic Inequality, Its Causes and Who Should Fix It”
PEW RESEARCH CENTER
Income and wealth have grown for each group. But the gains have been greatest for upper-income households, leading to increased economic inequality.
The median income for upper-income households increased 25% between 2001 and 2024 (from $222,800 to $278,800). Incomes for middle- and lower-income households grew less over that period – 22% and 17%, respectively. (All income figures have been adjusted for inflation.)
One way to measure income inequality is to look at the gap between upper- and lower-income households. In 2024, upper-income households had 7.3 times the typical income of lower-income households. The ratio was 6.8 in 2001.
Read about Americans’ views of economic inequality, including the factors they think contribute to it and who should be responsible for reducing it.
Income inequality varies across metropolitan areas
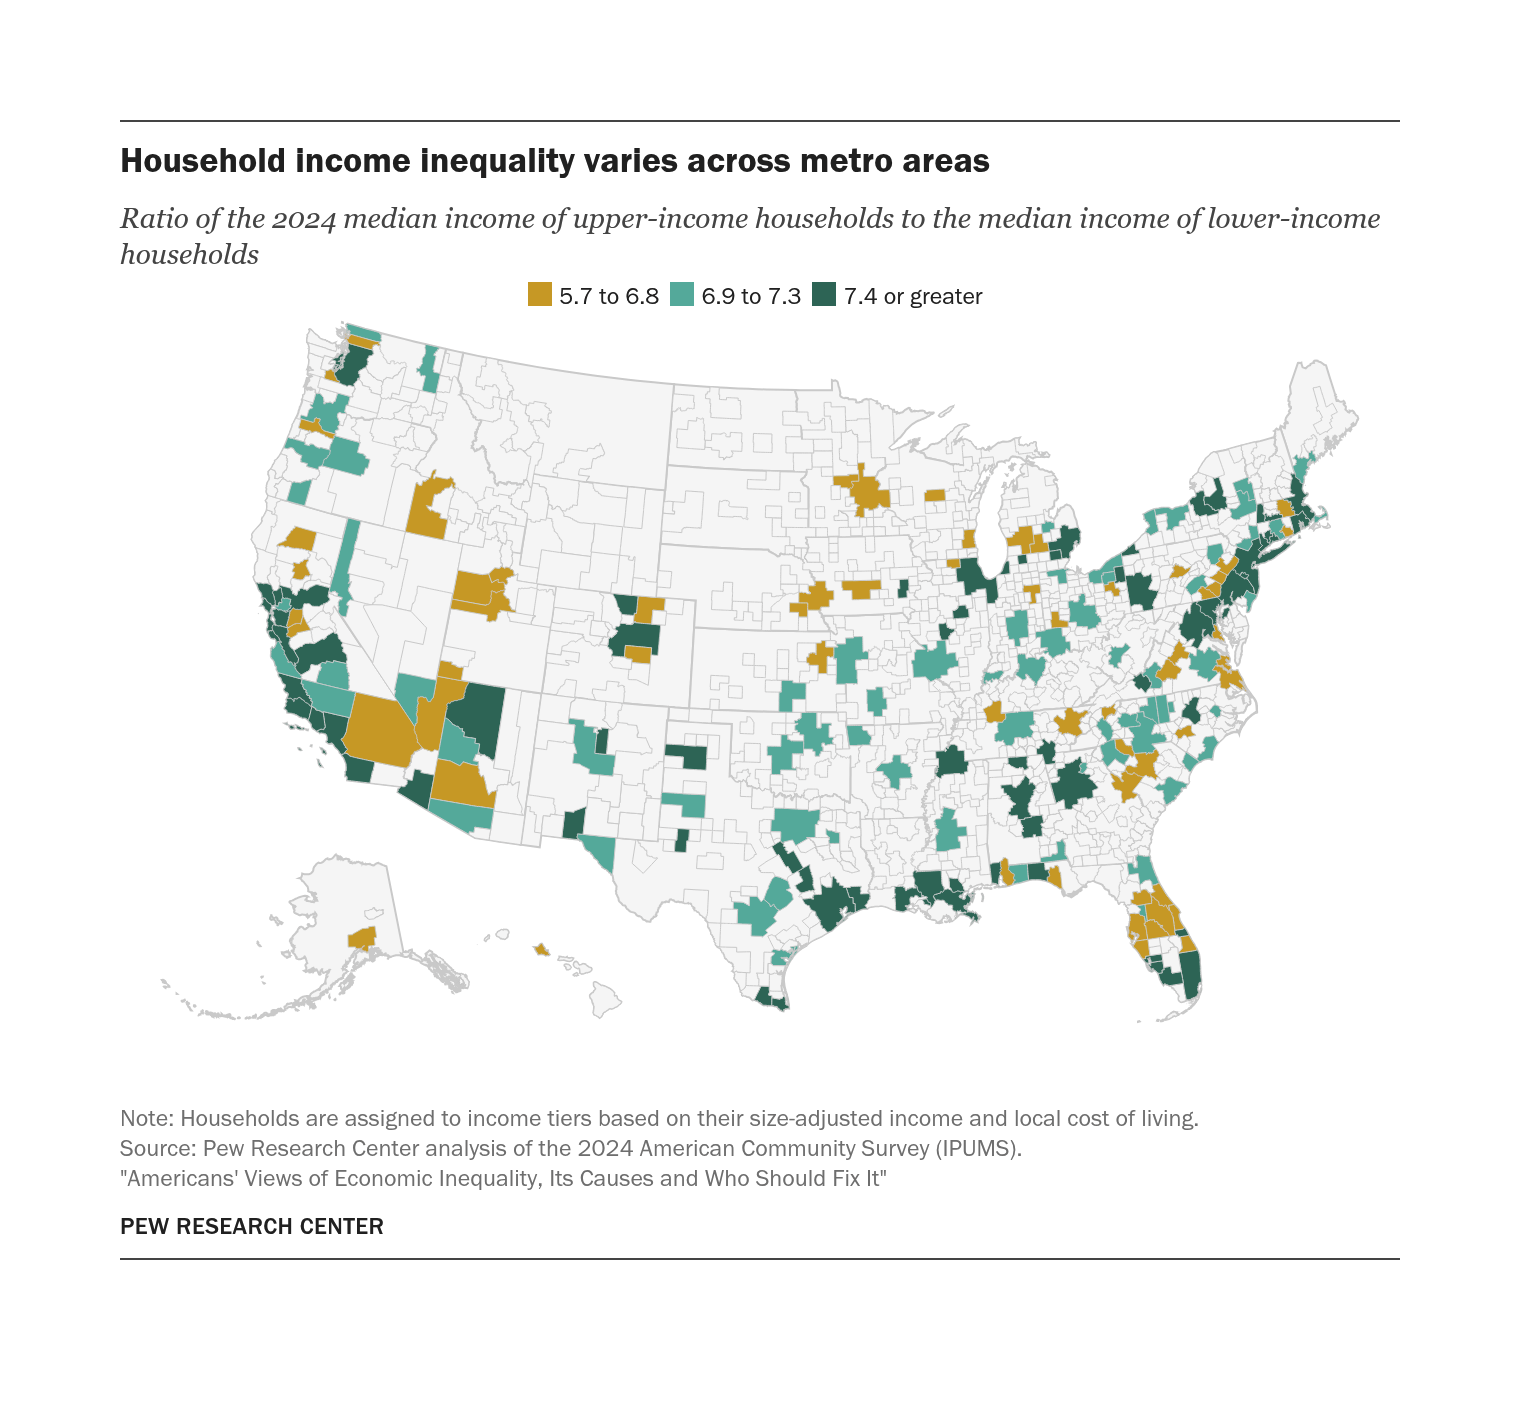
The income gap between upper- and lower-income households varies across the U.S. We analyzed 204 metropolitan areas and found the upper-to-lower income ratio ranged from 5.7 to 9.7, as of 2024.
Household income inequality varies across metro areas
Ratio of the 2024 median income of upper-income households to the median income of lower-income households
Note: Households are assigned to income tiers based on their size-adjusted income and local cost of living.
Source: Pew Research Center analysis of the 2024 American Community Survey (IPUMS).
“Americans’ Views of Economic Inequality, Its Causes and Who Should Fix It”
PEW RESEARCH CENTER
Household income inequality varies across metro areas
Ratio of the 2024 median income of upper-income households to the median income of lower-income households
Note: Households are assigned to income tiers based on their size-adjusted income and local cost of living.
Source: Pew Research Center analysis of the 2024 American Community Survey (IPUMS).
“Americans’ Views of Economic Inequality, Its Causes and Who Should Fix It”
PEW RESEARCH CENTER
The metro areas with the most income inequality are concentrated on the East and West coasts. However, the area with the highest upper-to-lower income ratio is in the middle of the country: In Iowa City, Iowa, upper-income households had 9.7 times the median income of lower-income households in 2024 ($239,300 vs. $24,600).
The metro area with the lowest level of income inequality was Canton-Massillon, Ohio. The median income of upper-income households there was 5.7 times higher than that of lower-income households ($235,000 vs. $41,200).
Wealth inequality is up sharply from 2001
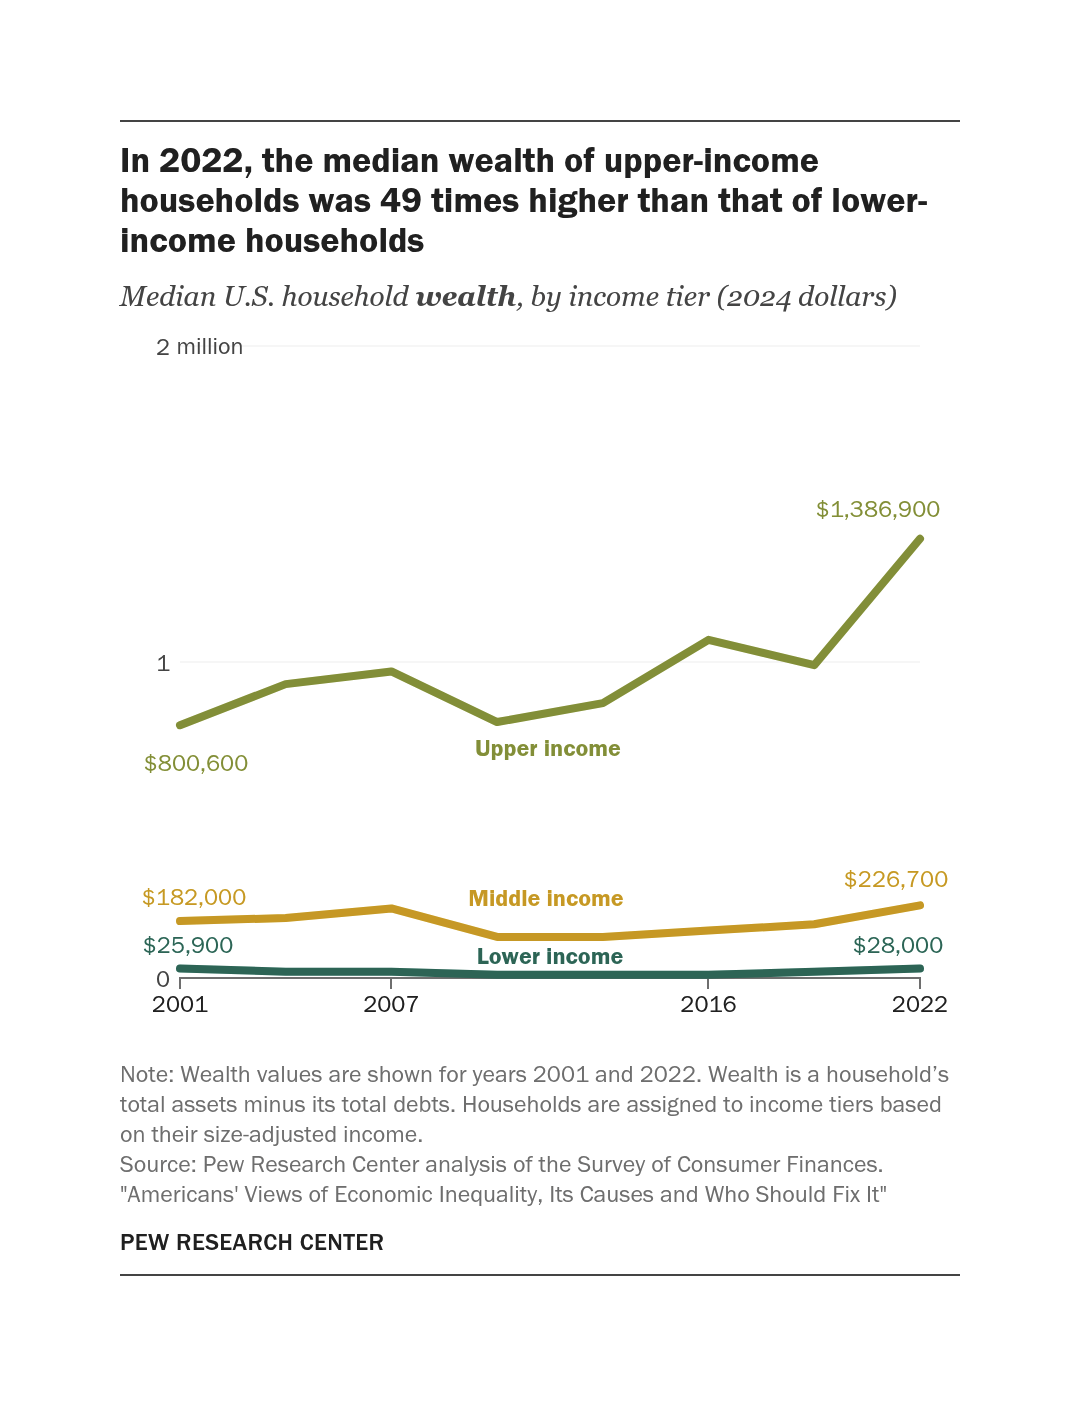
Wealth is spread much less evenly across U.S. households than income, and the gap in wealth between upper- and lower-income households has grown wider between 2001 and 2022.
In 2022, the median wealth of upper-income households was 49 times higher than that of lower-income households
Median U.S. household wealth, by income tier (2024 dollars)
Note: Wealth values are shown for years 2001 and 2022. Wealth is a household’s total assets minus its total debts. Households are assigned to income tiers based on their size-adjusted income.
Source: Pew Research Center analysis of the Survey of Consumer Finances.
“Americans’ Views of Economic Inequality, Its Causes and Who Should Fix It”
PEW RESEARCH CENTER
In 2022, the median wealth of upper-income households was 49 times higher than that of lower-income households
Median U.S. household wealth, by income tier (2024 dollars)
| Year | Lower income | Middle income | Upper income |
|---|---|---|---|
| 2001 | 0.03 | 0.18 | 0.8 |
| 2004 | 0.02 | 0.19 | 0.93 |
| 2007 | 0.02 | 0.22 | 0.97 |
| 2010 | 0.01 | 0.13 | 0.81 |
| 2013 | 0.01 | 0.13 | 0.87 |
| 2016 | 0.01 | 0.15 | 1.07 |
| 2019 | 0.02 | 0.17 | 0.99 |
| 2022 | 0.03 | 0.23 | 1.39 |
Note: Wealth values are shown for years 2001 and 2022. Wealth is a household’s total assets minus its total debts. Households are assigned to income tiers based on their size-adjusted income.
Source: Pew Research Center analysis of the Survey of Consumer Finances.
“Americans’ Views of Economic Inequality, Its Causes and Who Should Fix It”
PEW RESEARCH CENTER
Over that period, median wealth increased for middle- and upper-income households and remained mostly flat for lower-income households.
Upper-income households saw the largest gains, with wealth increasing 73% (from $800,600 to $1,386,900).
Wealth increased 25% for middle-income households and only 8% for lower-income households.
All told, upper-income households owned about 49 times the median wealth of lower-income households in 2022. That gap has increased from 31 times in 2001.
As the Federal Reserve and others have reported, while the wealth gap has widened significantly across households since 2001, it was even higher in 2016 than it was in 2022.