

The American Trends Panel survey methodology
Overview
The American Trends Panel (ATP), created by Pew Research Center, is a nationally representative panel of randomly selected U.S. adults. Panelists participate via self-administered web surveys. Panelists who do not have internet access at home are provided with a tablet and wireless internet connection. Interviews are conducted in both English and Spanish. The panel is being managed by Ipsos.
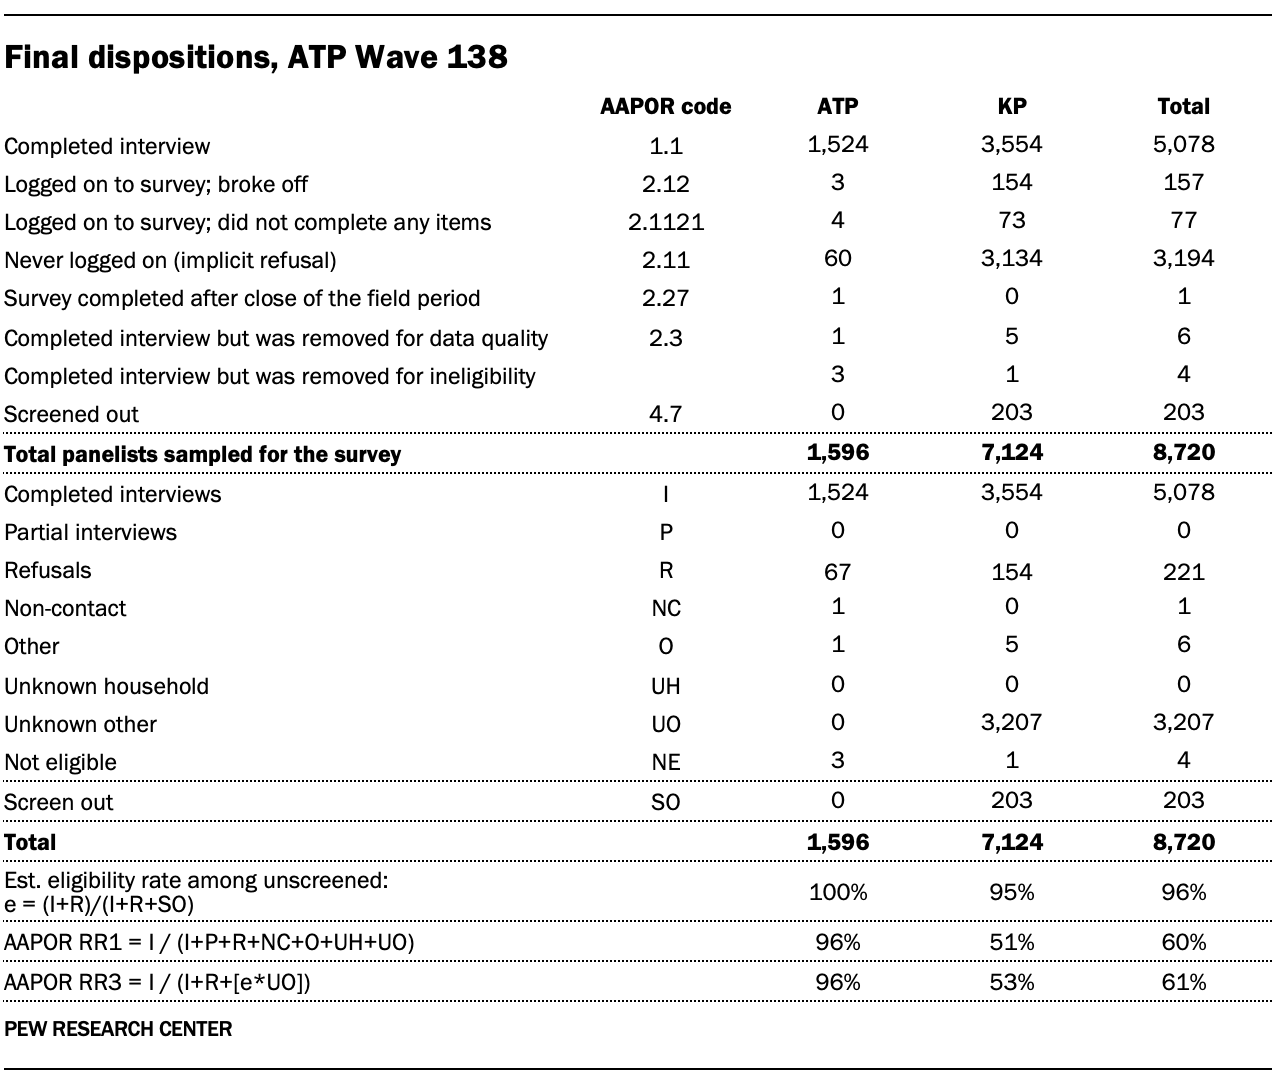
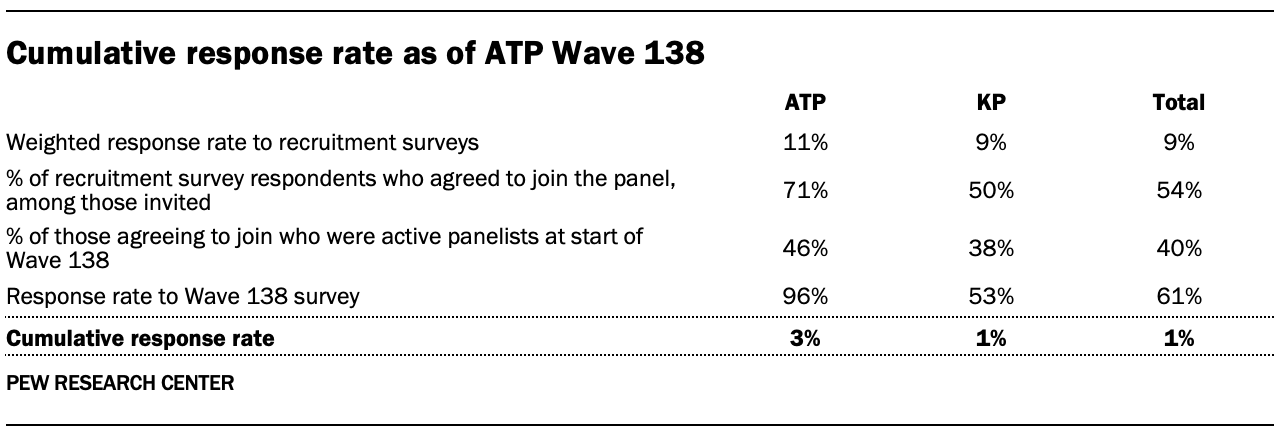
Data in this report is drawn from ATP Wave 138, conducted from Nov. 6 to Nov. 19, 2023, among a sample of U.S. adults who identify as Hispanic. A total of 5,078 panelists responded out of 8,720 who were sampled, for a response rate of 61% (AAPOR RR3). This included 1,524 respondents from the ATP and an additional 3,554 from Ipsos’ KnowledgePanel (KP). The cumulative response rate accounting for nonresponse to the recruitment surveys and attrition is 1%. The break-off rate among panelists who logged on to the survey and completed at least one item is 3%. The margin of sampling error for the full sample of 5,078 respondents is plus or minus 2.0 percentage points.
Panel recruitment
The ATP was created in 2014, with the first cohort of panelists invited to join the panel at the end of a large, national, landline and cellphone random-digit-dial survey that was conducted in both English and Spanish. Two additional recruitments were conducted using the same method in 2015 and 2017, respectively. Across these three surveys, a total of 19,718 adults were invited to join the ATP, of whom 9,942 (50%) agreed to participate.
In August 2018, the ATP switched from telephone to address-based sampling (ABS) recruitment. A study cover letter and a pre-incentive are mailed to a stratified, random sample of households selected from the U.S. Postal Service’s Delivery Sequence File. This Postal Service file has been estimated to cover as much as 98% of the population, although some studies suggest that the coverage could be in the low 90% range. Within each sampled household, the adult with the next birthday is asked to participate. Other details of the ABS recruitment protocol have changed over time but are available upon request.
We have recruited a national sample of U.S. adults to the ATP approximately once per year since 2014. In some years, the recruitment has included additional efforts (known as an “oversample”) to boost sample size with underrepresented groups. For example, Hispanic adults, Black adults and Asian adults were oversampled in 2019, 2022 and 2023, respectively.
Across the six address-based recruitments, a total of 23,862 adults were invited to join the ATP, of whom 20,917 agreed to join the panel and completed an initial profile survey. Of the 30,859 individuals who have ever joined the ATP, 11,936 remained active panelists and continued to receive survey invitations at the time this survey was conducted.
The American Trends Panel never uses breakout routers or chains that direct respondents to additional surveys.
Sample design
The overall target population for this survey was noninstitutionalized persons ages 18 and older living in the U.S., including Alaska and Hawaii who identify as Hispanic. All eligible members of the ATP and a random subsample of eligible members from Ipsos’ KnowledgePanel were invited to participate in this wave.
Questionnaire development and testing
The questionnaire was developed by Pew Research Center in consultation with Ipsos. The web program was rigorously tested on both PC and mobile devices by the Ipsos project management team and Pew Research Center researchers. The Ipsos project management team also populated test data that was analyzed in SPSS to ensure the logic and randomizations were working as intended before launching the survey.
Incentives
All ATP respondents were offered a post-paid incentive for their participation. ATP respondents could choose to receive the post-paid incentive in the form of a check or a gift code to Amazon.com or could choose to decline the incentive. Incentive amounts ranged from $5 to $20 depending on whether the respondent belongs to a part of the population that is harder or easier to reach. Differential incentive amounts were designed to increase panel survey participation among groups that traditionally have low survey response propensities.
Ipsos operates an ongoing modest incentive program for KnowledgePanel to encourage participation and create member loyalty. The incentive program includes special raffles and sweepstakes with both cash rewards and other prizes to be won. Typically, panel members are assigned no more than one survey per week. On average, panel members complete two to three surveys per month with durations of 10 to 15 minutes per survey. An additional incentive is usually provided for longer surveys. For this survey, during the last few days of data collection, KnowledgePanel members who self-identified as Black were offered 10,000 points (equivalent to $10) in addition to the regular incentive program in an attempt to boost the number of responses from panel members who identified as Black American.
Data collection protocol
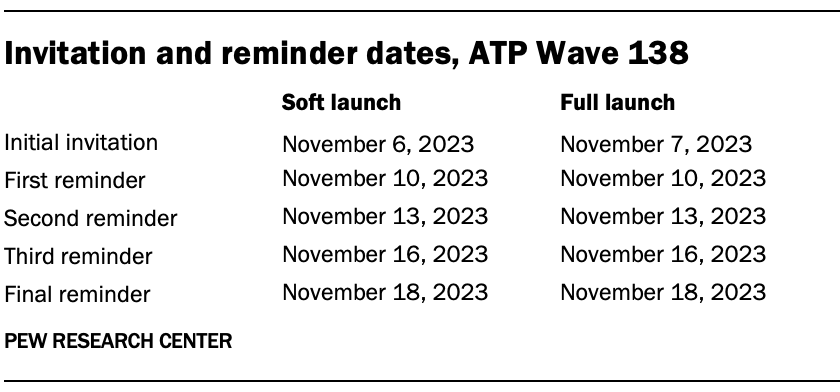
The data collection field period for this survey was Nov. 6 to Nov. 19, 2023. Postcard notifications were mailed to all ATP panelists with a known residential address on Nov. 6.
Invitations were sent out in two separate launches: soft launch and full launch. Sixty ATP panelists and 409 KP panelists were included in the soft launch, which began with an initial invitation sent on Nov 6. The ATP panelists chosen for the initial soft launch were known responders who had completed previous ATP surveys within one day of receiving their invitation. All remaining English- and Spanish-speaking sampled panelists were included in the full launch and were sent an invitation on Nov. 7.
All panelists with an email address received an email invitation and up to four email reminders if they did not respond to the survey. All ATP panelists who consented to SMS messages received an SMS invitation and up to four SMS reminders.
Data quality checks
To ensure high-quality data, the Center’s researchers performed data quality checks to identify any respondents showing clear patterns of satisficing. This includes checking for whether respondents left questions blank at very high rates or always selected the first or last answer presented. As a result of this checking, six respondents were removed from the survey dataset prior to weighting and analysis. Another four respondents were removed from the survey dataset after providing feedback that they were not Hispanic, and therefore not eligible for the survey.
Weighting
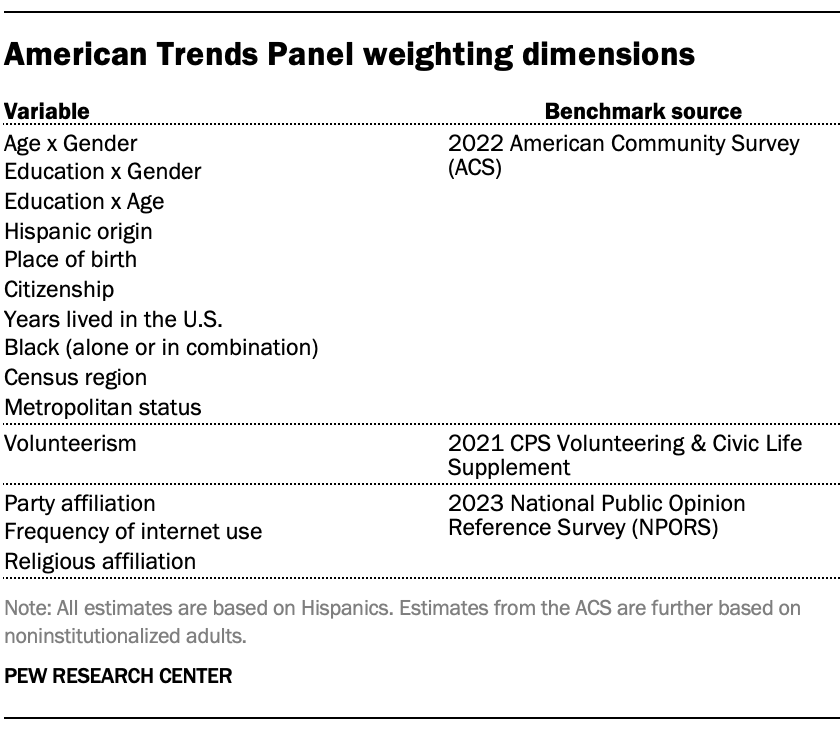
The ATP data is weighted in a multistep process that accounts for multiple stages of sampling and nonresponse that occur at different points in the survey process. First, each panelist begins with a base weight that reflects their probability of selection for their initial recruitment survey. These weights are then rescaled and adjusted to account for changes in the design of ATP recruitment surveys from year to year. Finally, the weights are calibrated to align with the population benchmarks in the accompanying table to correct for nonresponse to recruitment surveys and panel attrition. If only a subsample of panelists was invited to participate in the wave, this weight is adjusted to account for any differential probabilities of selection.
Among the panelists who completed the survey, this weight is then calibrated again to align with the population benchmarks identified in the accompanying table and trimmed at the 1st and 99th percentiles to reduce the loss in precision stemming from variance in the weights. Sampling errors and tests of statistical significance take into account the effect of weighting.
The following table shows the unweighted sample sizes and the error attributable to sampling that would be expected at the 95% level of confidence for different groups in the survey.
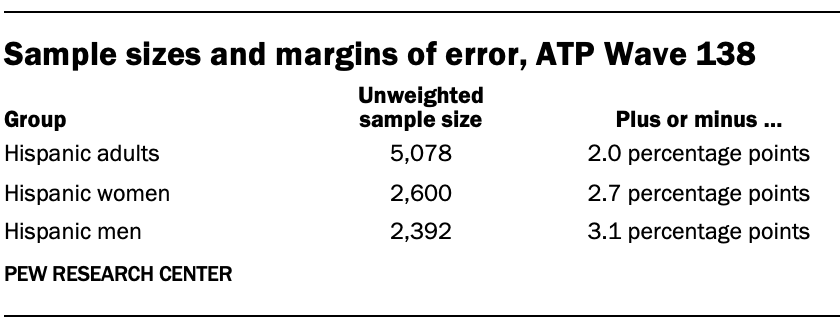
Sample sizes and sampling errors for other subgroups are available upon request. In addition to sampling error, one should bear in mind that question wording and practical difficulties in conducting surveys can introduce error or bias into the findings of opinion polls.
Dispositions and response rates
Methodology for the analysis of the Current Population Survey
This report’s demographic analysis is based on microdata from the U.S. Census Bureau’s and Bureau of Labor Statistics’ 2003, 2008, 2013, 2018 and 2023 Current Population Survey Monthly and Annual Social and Economic Supplement (ASEC) data series, provided through the Integrated Public Use Microdata Series (IPUMS) from the University of Minnesota.
The ASEC data series was used to create the following measures:
- Those participating in the labor force either were at work; held a job but were temporarily absent from work due to factors like vacation or illness; were seeking work; or were temporarily laid off from a job in the week before taking the Current Population Survey. In this report, the labor force participation rate is shown only for civilians ages 25 to 64.
- The phrases living with children or living with their own child describe individuals living with at least one of their own stepchildren, adopted children or biological children, regardless of the children’s ages. The phrases not living with children or not living with their own child describe individuals who have no children or whose children do not live with them.
- Occupation and occupational groups describe the occupational category of someone’s current job, or – if unemployed – most recent job. In this report we measure occupation among civilians participating in the labor force. Occupational groups are adapted from the U.S. Census Bureau’s occupation classification list from 2018 onward.
- Breadwinners refer to those living with a spouse or partner, both ages 25 to 64, who make over 60% of their and their partner’s combined, positive income from all sources. Those in egalitarian relationships make 40% to 60% of the combined income. For those who make less than 40% of the combined income, their spouse or partner is the breadwinner. This analysis was conducted among both opposite-sex and same-sex couples.
The CPS Monthly microdata series was used only to calculate median hourly wages for those ages 25 to 64 years old and who were not self-employed. Medians were calculated for the whole year by considering all wages reported in that year, regardless of month. Median wages for years prior to 2023 were then adjusted to June 2023 dollars using the Chained Consumer Price Index for All Urban Consumers for June of each year.


