

National Park Service, Weather Service, U.S. Postal Service are viewed positively across the political spectrum

Americans’ views of several major federal government agencies and departments are generally positive, with some exceptions.
On balance, Americans view eight of 12 federal agencies we asked about more favorably than unfavorably, according to a Pew Research Center survey of 5,062 adults conducted from Sept. 28 to Oct. 4, 2026.
The National Park Service, National Weather Service and U.S. Postal Service are viewed especially positively: Two-thirds or more of Americans view each favorably.
National Park Service, Weather Service, USPS widely viewed positively, while ICE, IRS rank as least popular federal agencies
% who have a(n) __ opinion of each federal agency

Note: Net favorability is the percentage favorable minus the percentage unfavorable.
Source: Survey of U.S. adults conducted Sept. 28-Oct. 4, 2026.
PEW RESEARCH CENTER
National Park Service, Weather Service, USPS widely viewed positively, while ICE, IRS rank as least popular federal agencies
% who have a(n) __ opinion of each federal agency
| Agency | Favorable | Unfavorable | Not sure | NET Fav |
|---|---|---|---|---|
| National Park Service | 73 | 9 | 17 | 64 |
| National Weather Service | 72 | 13 | 15 | 59 |
| U.S. Postal Service | 68 | 22 | 10 | 46 |
| Federal Reserve | 48 | 29 | 22 | 19 |
| FBI | 48 | 36 | 15 | 12 |
| CDC | 47 | 39 | 14 | 8 |
| Health and Human Services | 44 | 38 | 17 | 6 |
| Dept. of Homeland Security | 43 | 42 | 14 | 1 |
| State Dept. | 42 | 33 | 24 | 9 |
| Dept. of Justice | 40 | 45 | 14 | -5 |
| IRS | 37 | 46 | 16 | -9 |
| ICE | 35 | 56 | 9 | -21 |
Note: Net favorability is the percentage favorable minus the percentage unfavorable.
Source: Survey of U.S. adults conducted Sept. 28-Oct. 4, 2026.
PEW RESEARCH CENTER
The least popular agency of the 12 asked about is Immigration and Customs Enforcement (ICE), a component of the Department of Homeland Security (DHS). A majority of Americans (56%) express an unfavorable opinion of ICE, while 35% express a favorable opinion.
Related: Americans’ Views of ICE Grow More Negative
How Republicans and Democrats view federal agencies
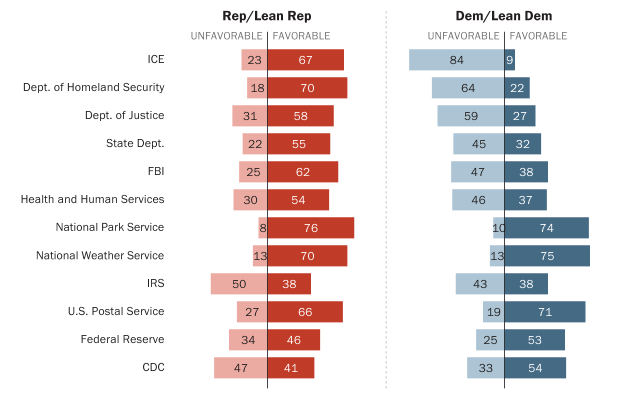
Wide partisan gaps in views of many federal agencies, but majorities in both parties view the National Park Service, Weather Service and USPS favorably
% who have a(n) __ opinion of each federal agency
Note: “Not sure” and no answer responses are not shown.
Source: Survey of U.S. adults conducted Sept. 28-Oct. 4, 2026.
PEW RESEARCH CENTER
Wide partisan gaps in views of many federal agencies, but majorities in both parties view the National Park Service, Weather Service and USPS favorably
% who have a(n) __ opinion of each federal agency
| Agency | Group | Favorable | Unfavorable |
|---|---|---|---|
| ICE | Rep/Lean Rep | 67 | 23 |
| Dept. of Homeland Security | Rep/Lean Rep | 70 | 18 |
| Dept. of Justice | Rep/Lean Rep | 58 | 31 |
| State Dept. | Rep/Lean Rep | 55 | 22 |
| FBI | Rep/Lean Rep | 62 | 25 |
| Health and Human Services | Rep/Lean Rep | 54 | 30 |
| National Park Service | Rep/Lean Rep | 76 | 8 |
| National Weather Service | Rep/Lean Rep | 70 | 13 |
| IRS | Rep/Lean Rep | 38 | 50 |
| U.S. Postal Service | Rep/Lean Rep | 66 | 27 |
| Federal Reserve | Rep/Lean Rep | 46 | 34 |
| CDC | Rep/Lean Rep | 41 | 47 |
| ICE | Dem/Lean Dem | 9 | 84 |
| Dept. of Homeland Security | Dem/Lean Dem | 22 | 64 |
| Dept. of Justice | Dem/Lean Dem | 27 | 59 |
| State Dept. | Dem/Lean Dem | 32 | 45 |
| FBI | Dem/Lean Dem | 38 | 47 |
| Health and Human Services | Dem/Lean Dem | 37 | 46 |
| National Park Service | Dem/Lean Dem | 74 | 10 |
| National Weather Service | Dem/Lean Dem | 75 | 13 |
| IRS | Dem/Lean Dem | 38 | 43 |
| U.S. Postal Service | Dem/Lean Dem | 71 | 19 |
| Federal Reserve | Dem/Lean Dem | 53 | 25 |
| CDC | Dem/Lean Dem | 54 | 33 |
Note: “Not sure” and no answer responses are not shown.
Source: Survey of U.S. adults conducted Sept. 28-Oct. 4, 2026.
PEW RESEARCH CENTER
There are wide partisan gaps in views of several agencies.
Today, Republicans and Republican-leaning independents are more likely than Democrats and Democratic leaners to view ICE, DHS, the Department of Justice, the State Department, the FBI and the Department of Health and Human Services favorably.
The partisan gap on views of ICE is particularly wide: 67% of Republicans view the agency favorably, while 9% of Democrats say the same.
For partisan trends on views of ICE, read “Americans’ Views of ICE Grow More Negative.”
Wide partisan differences in net favorability of ICE, DHS, DOJ and other agencies
Net favorability rating of each federal agency
Note: Net favorability is the percentage favorable minus the percentage unfavorable.
Source: Survey of U.S. adults conducted Sept. 28-Oct. 4, 2026.
PEW RESEARCH CENTER
Wide partisan differences in net favorability of ICE, DHS, DOJ and other agencies
Net favorability rating of each federal agency
| Agency | Rep/Lean Rep | Dem/Lean Dem |
|---|---|---|
| ICE | 44 | -75 |
| Dept. of Homeland Security | 52 | -42 |
| Dept. of Justice | 27 | -32 |
| State Dept. | 33 | -13 |
| FBI | 37 | -9 |
| Health and Human Services | 24 | -9 |
| National Park Service | 68 | 64 |
| National Weather Service | 57 | 62 |
| IRS | -12 | -5 |
| U.S. Postal Service | 39 | 52 |
| Federal Reserve | 12 | 28 |
| CDC | -6 | 21 |
Note: Net favorability is the percentage favorable minus the percentage unfavorable.
Source: Survey of U.S. adults conducted Sept. 28-Oct. 4, 2026.
PEW RESEARCH CENTER
Democrats are more likely than Republicans to hold a favorable views of the Centers for Disease Control and Prevention (CDC) and the Federal Reserve.
Trends in views of federal agencies among partisans
The State Department, DHS and ICE
State Department
A majority of Republicans (55%) express a positive opinion of the State Department, while 22% express a negative opinion – nearly identical to views a year ago.
Democrats’ views of the State Department have grown more negative over the last year. Now, more Democrats have an unfavorable (45%) than favorable (32%) view of the department.
Democrats grow more negative toward the State Department
% who have a(n) __ opinion of the State Department

Note: No answer responses are not shown.
Source: Survey of U.S. adults conducted Sept. 28-Oct. 4, 2026.
PEW RESEARCH CENTER
Democrats grow more negative toward the State Department
% who have a(n) __ opinion of the State Department
| Year | Agency | Group | Favorable | Unfavorable | Not sure |
|---|---|---|---|---|---|
| 2025 | State Department | Total | 45 | 31 | 24 |
| 2026 | State Department | Total | 42 | 33 | 24 |
| 2025 | State Department | Rep/Lean Rep | 57 | 23 | 20 |
| 2026 | State Department | Rep/Lean Rep | 55 | 22 | 22 |
| 2025 | State Department | Dem/Lean Dem | 37 | 39 | 24 |
| 2026 | State Department | Dem/Lean Dem | 32 | 45 | 22 |
Note: No answer responses are not shown.
Source: Survey of U.S. adults conducted Sept. 28-Oct. 4, 2026.
PEW RESEARCH CENTER
Department of Homeland Security
Seven-in-ten Republicans express a positive view of DHS, essentially unchanged since 2025. About two-in-ten Democrats (22%) view it favorably, down modestly from a year ago (26%).
Republicans and Democrats remain far apart in views of DHS
% who have a(n) __ opinion of the Department of Homeland Security

Note: No answer responses are not shown.
Source: Survey of U.S. adults conducted Sept. 28-Oct. 4, 2026.
PEW RESEARCH CENTER
Republicans and Democrats remain far apart in views of DHS
% who have a(n) __ opinion of the Department of Homeland Security
| Year | Agency | Group | Favorable | Unfavorable | Not sure |
|---|---|---|---|---|---|
| 2023 | Dept. of Homeland Security | Total | 51 | 35 | 13 |
| 2024 | Dept. of Homeland Security | Total | 48 | 36 | 15 |
| 2025 | Dept. of Homeland Security | Total | 46 | 40 | 13 |
| 2026 | Dept. of Homeland Security | Total | 43 | 42 | 14 |
| 2023 | Dept. of Homeland Security | Rep/Lean Rep | 47 | 43 | 10 |
| 2024 | Dept. of Homeland Security | Rep/Lean Rep | 41 | 47 | 12 |
| 2025 | Dept. of Homeland Security | Rep/Lean Rep | 68 | 21 | 10 |
| 2026 | Dept. of Homeland Security | Rep/Lean Rep | 70 | 18 | 11 |
| 2023 | Dept. of Homeland Security | Dem/Lean Dem | 56 | 29 | 14 |
| 2024 | Dept. of Homeland Security | Dem/Lean Dem | 57 | 26 | 16 |
| 2025 | Dept. of Homeland Security | Dem/Lean Dem | 26 | 60 | 14 |
| 2026 | Dept. of Homeland Security | Dem/Lean Dem | 22 | 64 | 14 |
Note: No answer responses are not shown.
Source: Survey of U.S. adults conducted Sept. 28-Oct. 4, 2026.
PEW RESEARCH CENTER
Immigration and Customs Enforcement
The public’s views of ICE have grown more negative over the last year: 56% now view the agency unfavorably, up from 49% last year. While ICE continues to be viewed far more positively among Republicans than Democrats, the negative shift in perceptions is seen in both parties. (For more on views of ICE, read “Americans’ Views of ICE Grow More Negative.”)
Growing shares in both parties view ICE unfavorably, even as a wide partisan gap persists
% who have a(n) __ opinion of Immigration and Customs Enforcement

Note: No answer responses are not shown.
Source: Survey of U.S. adults conducted Sept. 28-Oct. 4, 2026.
PEW RESEARCH CENTER
Growing shares in both parties view ICE unfavorably, even as a wide partisan gap persists
% who have a(n) __ opinion of Immigration and Customs Enforcement
| Year | Agency | Group | Favorable | Unfavorable | Not sure |
|---|---|---|---|---|---|
| 2025 | ICE | Total | 40 | 49 | 10 |
| 2026 | ICE | Total | 35 | 56 | 9 |
| 2025 | ICE | Rep/Lean Rep | 72 | 21 | 7 |
| 2026 | ICE | Rep/Lean Rep | 67 | 23 | 9 |
| 2025 | ICE | Dem/Lean Dem | 13 | 78 | 9 |
| 2026 | ICE | Dem/Lean Dem | 9 | 84 | 7 |
Note: No answer responses are not shown.
Source: Survey of U.S. adults conducted Sept. 28-Oct. 4, 2026.
PEW RESEARCH CENTER
Health and Human Services and CDC
Both the Department of Health and Human Services and the Centers for Disease Control and Prevention are viewed more negatively by the public today than they were a year ago – the result of shifting views among Democrats.
Department of Health and Human Services
Currently, 46% of Democrats rate HHS unfavorably, while 37% rate it favorably. A year ago, more Democrats rated HHS favorably (47%) than unfavorably (38%).
Democrats now hold more negative than positive views of HHS
% who have a(n) __ opinion of the Department of Health and Human Services

Note: No answer responses are not shown.
Source: Survey of U.S. adults conducted Sept. 28-Oct. 4, 2026.
PEW RESEARCH CENTER
Democrats now hold more negative than positive views of HHS
% who have a(n) __ opinion of the Department of Health and Human Services
| Year | Agency | Group | Favorable | Unfavorable | Not sure |
|---|---|---|---|---|---|
| 2023 | HHS | Total | 55 | 30 | 15 |
| 2024 | HHS | Total | 50 | 31 | 18 |
| 2025 | HHS | Total | 48 | 36 | 15 |
| 2026 | HHS | Total | 44 | 38 | 17 |
| 2023 | HHS | Rep/Lean Rep | 39 | 47 | 13 |
| 2024 | HHS | Rep/Lean Rep | 33 | 49 | 18 |
| 2025 | HHS | Rep/Lean Rep | 51 | 36 | 13 |
| 2026 | HHS | Rep/Lean Rep | 54 | 30 | 16 |
| 2023 | HHS | Dem/Lean Dem | 70 | 15 | 15 |
| 2024 | HHS | Dem/Lean Dem | 68 | 14 | 18 |
| 2025 | HHS | Dem/Lean Dem | 47 | 38 | 15 |
| 2026 | HHS | Dem/Lean Dem | 37 | 46 | 16 |
Note: No answer responses are not shown.
Source: Survey of U.S. adults conducted Sept. 28-Oct. 4, 2026.
PEW RESEARCH CENTER
Centers for Disease Control and Prevention
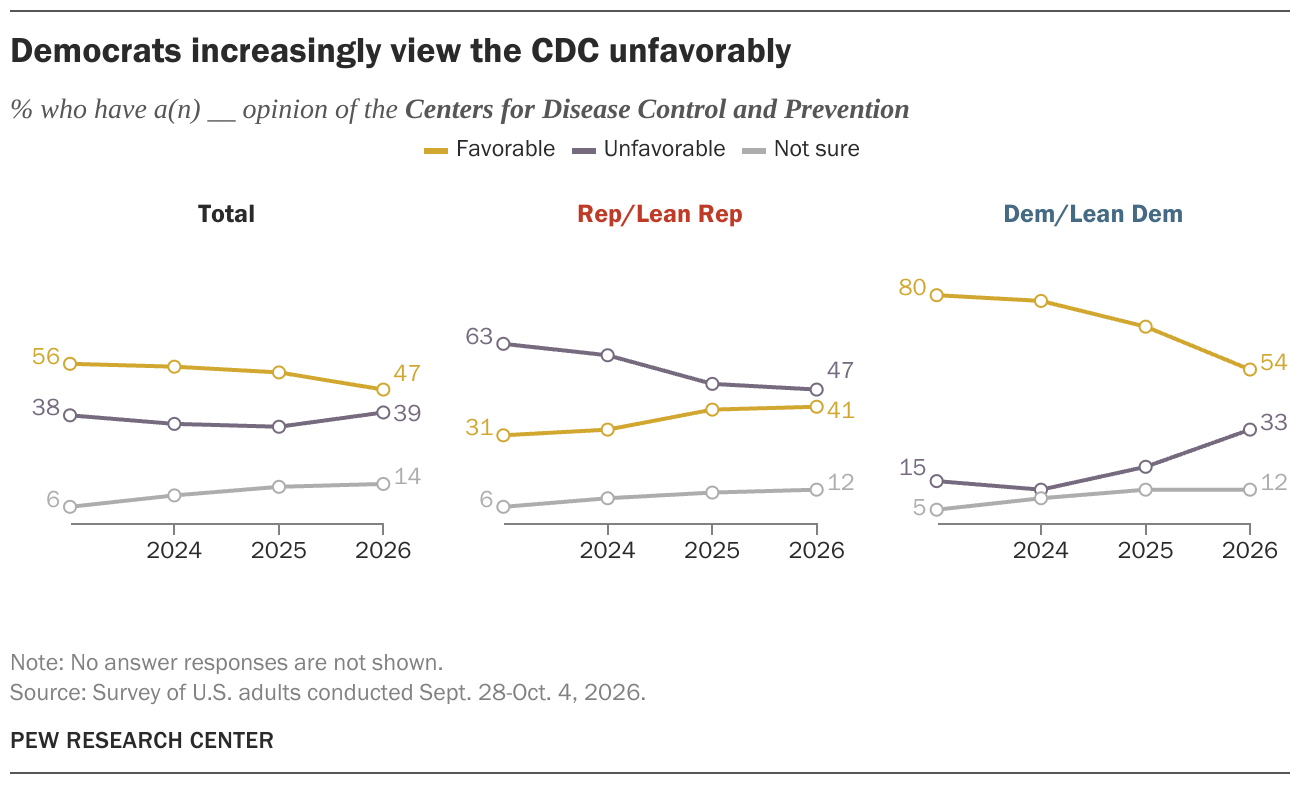
While Democrats continue to be more likely than Republicans to view the CDC favorably, that gap has now narrowed.
A majority of Democrats (54%) currently rate the CDC positively, but this is down from the 69% who said the same a year ago.
About four-in-ten Republicans (41%) rate the CDC favorably, compared with 47% who rate it unfavorably – nearly identical to last year.
Democrats increasingly view the CDC unfavorably
% who have a(n) __ opinion of the Centers for Disease Control and Prevention
Note: No answer responses are not shown.
Source: Survey of U.S. adults conducted Sept. 28-Oct. 4, 2026.
PEW RESEARCH CENTER
Democrats increasingly view the CDC unfavorably
% who have a(n) __ opinion of the Centers for Disease Control and Prevention
| Year | Agency | Group | Favorable | Unfavorable | Not sure | Panel |
|---|---|---|---|---|---|---|
| 2023 | CDC | Total | 56 | 38 | 6 | CDCTotal |
| 2024 | CDC | Total | 55 | 35 | 10 | CDCTotal |
| 2025 | CDC | Total | 53 | 34 | 13 | CDCTotal |
| 2026 | CDC | Total | 47 | 39 | 14 | CDCTotal |
| 2023 | CDC | Rep/Lean Rep | 31 | 63 | 6 | CDCRep/Lean Rep |
| 2024 | CDC | Rep/Lean Rep | 33 | 59 | 9 | CDCRep/Lean Rep |
| 2025 | CDC | Rep/Lean Rep | 40 | 49 | 11 | CDCRep/Lean Rep |
| 2026 | CDC | Rep/Lean Rep | 41 | 47 | 12 | CDCRep/Lean Rep |
| 2023 | CDC | Dem/Lean Dem | 80 | 15 | 5 | CDCDem/Lean Dem |
| 2024 | CDC | Dem/Lean Dem | 78 | 12 | 9 | CDCDem/Lean Dem |
| 2025 | CDC | Dem/Lean Dem | 69 | 20 | 12 | CDCDem/Lean Dem |
| 2026 | CDC | Dem/Lean Dem | 54 | 33 | 12 | CDCDem/Lean Dem |
Note: No answer responses are not shown.
Source: Survey of U.S. adults conducted Sept. 28-Oct. 4, 2026.
PEW RESEARCH CENTER
Justice Department and FBI
While overall views of the nation’s major law enforcement agencies are little changed over the last year, the partisan trends continue to diverge.
Department of Justice
Views of the Justice Department have improved among Republicans: 58% have a positive view of the DOJ, up from 51% a year ago.
A majority of Democrats (59%) express a negative view of the DOJ – a nearly identical share to last year.
Republicans’ views of Justice Department grow more positive
% who have a(n) __ opinion of the Department of Justice

Note: No answer responses are not shown.
Source: Survey of U.S. adults conducted Sept. 28-Oct. 4, 2026.
PEW RESEARCH CENTER
Republicans’ views of Justice Department grow more positive
% who have a(n) __ opinion of the Department of Justice
| Year | Agency | Group | Favorable | Unfavorable | Not sure |
|---|---|---|---|---|---|
| 2023 | Dept. of Justice | Total | 49 | 41 | 10 |
| 2024 | Dept. of Justice | Total | 43 | 44 | 13 |
| 2025 | Dept. of Justice | Total | 39 | 46 | 15 |
| 2026 | Dept. of Justice | Total | 40 | 45 | 14 |
| 2023 | Dept. of Justice | Rep/Lean Rep | 40 | 50 | 9 |
| 2024 | Dept. of Justice | Rep/Lean Rep | 33 | 56 | 11 |
| 2025 | Dept. of Justice | Rep/Lean Rep | 51 | 35 | 13 |
| 2026 | Dept. of Justice | Rep/Lean Rep | 58 | 31 | 11 |
| 2023 | Dept. of Justice | Dem/Lean Dem | 57 | 34 | 9 |
| 2024 | Dept. of Justice | Dem/Lean Dem | 55 | 32 | 12 |
| 2025 | Dept. of Justice | Dem/Lean Dem | 28 | 58 | 13 |
| 2026 | Dept. of Justice | Dem/Lean Dem | 27 | 59 | 13 |
Note: No answer responses are not shown.
Source: Survey of U.S. adults conducted Sept. 28-Oct. 4, 2026.
PEW RESEARCH CENTER
FBI
About six-in-ten Republicans (62%) rate the FBI favorably, up from a year ago, when 54% rated the FBI favorably.
By contrast, Democrats now rate the FBI more negatively (47%) than positively (39%). A year ago, Democrats were more likely to rate the agency favorably (45%) than unfavorably (38%).
Republicans grow more favorable toward FBI, Democrats more unfavorable
% who have a(n) __ opinion of the Federal Bureau of Investigation
Note: No answer responses are not shown.
Source: Survey of U.S. adults conducted Sept. 28-Oct. 4, 2026.
PEW RESEARCH CENTER
Republicans grow more favorable toward FBI, Democrats more unfavorable
% who have a(n) __ opinion of the Federal Bureau of Investigation
| Year | Agency | Group | Favorable | Unfavorable | Not sure |
|---|---|---|---|---|---|
| 2023 | FBI | Total | 52 | 36 | 12 |
| 2024 | FBI | Total | 51 | 33 | 16 |
| 2025 | FBI | Total | 48 | 36 | 16 |
| 2026 | FBI | Total | 48 | 36 | 15 |
| 2023 | FBI | Rep/Lean Rep | 38 | 53 | 9 |
| 2024 | FBI | Rep/Lean Rep | 37 | 50 | 13 |
| 2025 | FBI | Rep/Lean Rep | 54 | 34 | 12 |
| 2026 | FBI | Rep/Lean Rep | 62 | 25 | 13 |
| 2023 | FBI | Dem/Lean Dem | 65 | 22 | 13 |
| 2024 | FBI | Dem/Lean Dem | 66 | 17 | 16 |
| 2025 | FBI | Dem/Lean Dem | 45 | 39 | 16 |
| 2026 | FBI | Dem/Lean Dem | 38 | 47 | 15 |
Note: No answer responses are not shown.
Source: Survey of U.S. adults conducted Sept. 28-Oct. 4, 2026.
PEW RESEARCH CENTER
Federal Reserve and IRS
Federal Reserve
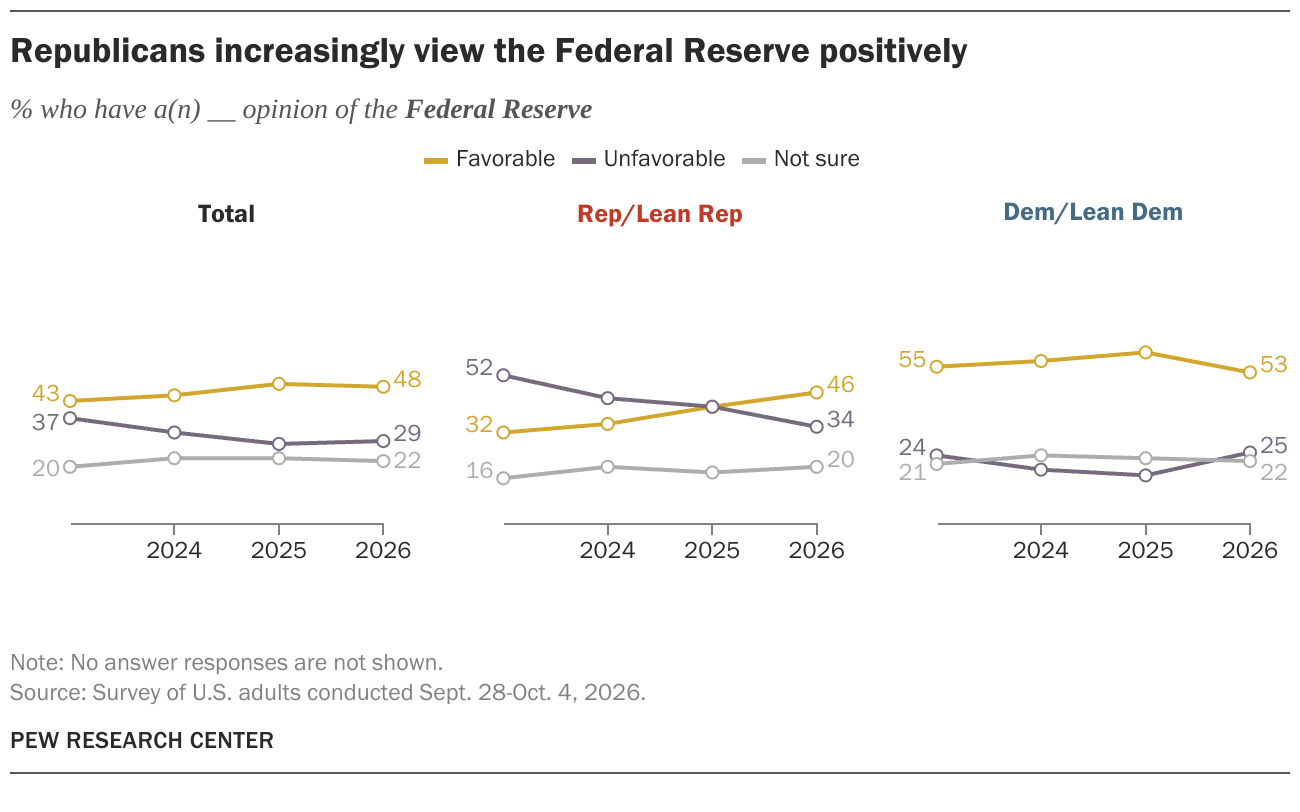
Republicans’ views of the Federal Reserve have improved: 46% view it favorably, while 34% view it unfavorably.
About half of Democrats (53%) rate the Fed positively, though that share is down from 60% in 2025.
Republicans increasingly view the Federal Reserve positively
% who have a(n) __ opinion of the Federal Reserve
Note: No answer responses are not shown.
Source: Survey of U.S. adults conducted Sept. 28-Oct. 4, 2026.
PEW RESEARCH CENTER
Republicans increasingly view the Federal Reserve positively
% who have a(n) __ opinion of the Federal Reserve
| Year | Agency | Group | Favorable | Unfavorable | Not sure |
|---|---|---|---|---|---|
| 2023 | Federal Reserve | Total | 43 | 37 | 20 |
| 2024 | Federal Reserve | Total | 45 | 32 | 23 |
| 2025 | Federal Reserve | Total | 49 | 28 | 23 |
| 2026 | Federal Reserve | Total | 48 | 29 | 22 |
| 2023 | Federal Reserve | Rep/Lean Rep | 32 | 52 | 16 |
| 2024 | Federal Reserve | Rep/Lean Rep | 35 | 44 | 20 |
| 2025 | Federal Reserve | Rep/Lean Rep | 41 | 41 | 18 |
| 2026 | Federal Reserve | Rep/Lean Rep | 46 | 34 | 20 |
| 2023 | Federal Reserve | Dem/Lean Dem | 55 | 24 | 21 |
| 2024 | Federal Reserve | Dem/Lean Dem | 57 | 19 | 24 |
| 2025 | Federal Reserve | Dem/Lean Dem | 60 | 17 | 23 |
| 2026 | Federal Reserve | Dem/Lean Dem | 53 | 25 | 22 |
Note: No answer responses are not shown.
Source: Survey of U.S. adults conducted Sept. 28-Oct. 4, 2026.
PEW RESEARCH CENTER
IRS
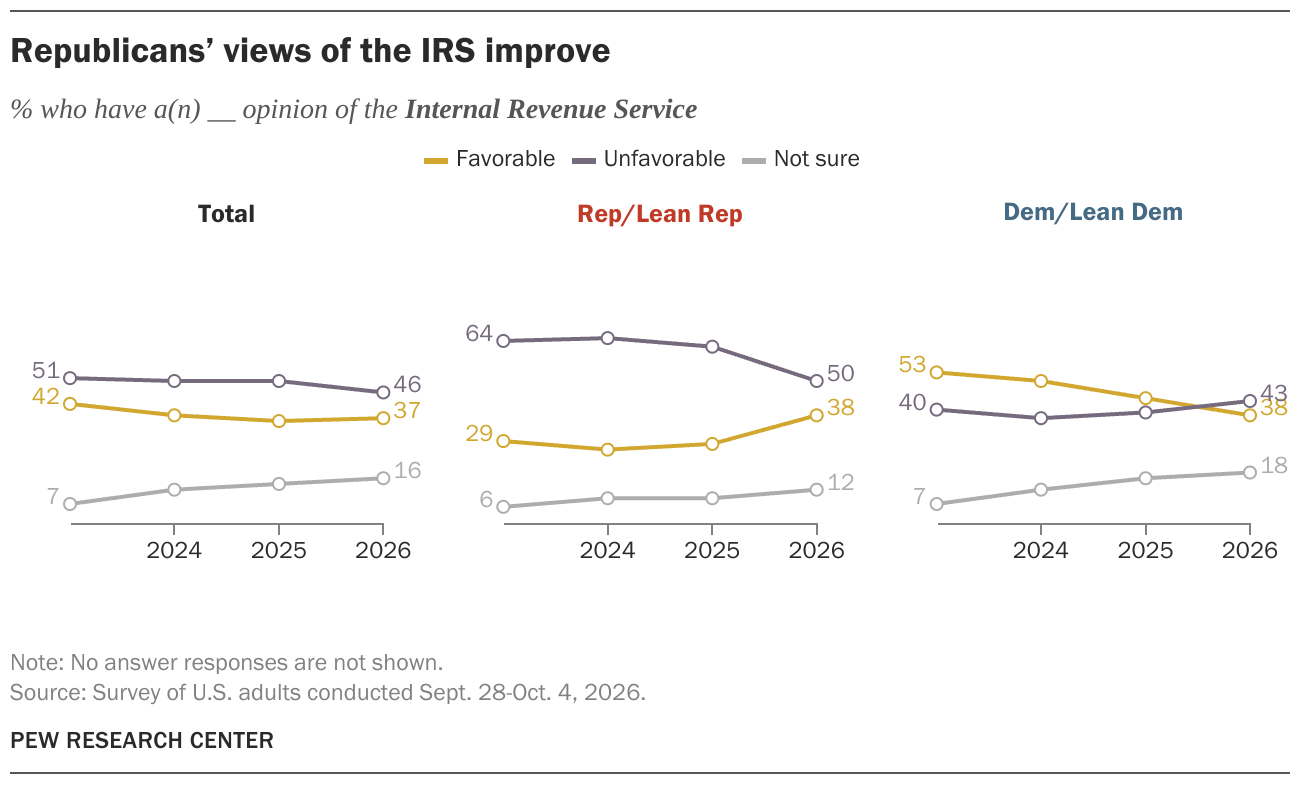
Though both parties view the Internal Revenue Service unfavorably, their views have trended in opposite directions. Republicans have grown more favorable toward the IRS: 38% now view the agency favorably, up from 28% a year ago. By comparison, 38% of Democrats now express a positive view of the agency, down from 44% last year.
Republicans’ views of the IRS improve
% who have a(n) __ opinion of the Internal Revenue Service
Note: No answer responses are not shown.
Source: Survey of U.S. adults conducted Sept. 28-Oct. 4, 2026.
PEW RESEARCH CENTER
Republicans’ views of the IRS improve
% who have a(n) __ opinion of the Internal Revenue Service
| Year | Agency | Group | Favorable | Unfavorable | Not sure |
|---|---|---|---|---|---|
| 2023 | IRS | Total | 42 | 51 | 7 |
| 2024 | IRS | Total | 38 | 50 | 12 |
| 2025 | IRS | Total | 36 | 50 | 14 |
| 2026 | IRS | Total | 37 | 46 | 16 |
| 2023 | IRS | Rep/Lean Rep | 29 | 64 | 6 |
| 2024 | IRS | Rep/Lean Rep | 26 | 65 | 9 |
| 2025 | IRS | Rep/Lean Rep | 28 | 62 | 9 |
| 2026 | IRS | Rep/Lean Rep | 38 | 50 | 12 |
| 2023 | IRS | Dem/Lean Dem | 53 | 40 | 7 |
| 2024 | IRS | Dem/Lean Dem | 50 | 37 | 12 |
| 2025 | IRS | Dem/Lean Dem | 44 | 39 | 16 |
| 2026 | IRS | Dem/Lean Dem | 38 | 43 | 18 |
Note: No answer responses are not shown.
Source: Survey of U.S. adults conducted Sept. 28-Oct. 4, 2026.
PEW RESEARCH CENTER
National Park Service, National Weather Service, USPS
National Park Service
The National Park Service remains broadly popular, though the share of Democrats who hold a favorable opinion is down slightly, from 79% in 2025 to 74% today.
Majorities in both parties continue to rate the National Park Service highly
% who have a(n) __ opinion of the National Park Service

Note: No answer responses are not shown.
Source: Survey of U.S. adults conducted Sept. 28-Oct. 4, 2026.
PEW RESEARCH CENTER
Majorities in both parties continue to rate the National Park Service highly
% who have a(n) __ opinion of the National Park Service
| Year | Agency | Group | Favorable | Unfavorable | Not sure |
|---|---|---|---|---|---|
| 2023 | National Park Service | Total | 81 | 7 | 12 |
| 2024 | National Park Service | Total | 76 | 7 | 17 |
| 2025 | National Park Service | Total | 76 | 8 | 15 |
| 2026 | National Park Service | Total | 73 | 9 | 17 |
| 2023 | National Park Service | Rep/Lean Rep | 81 | 9 | 10 |
| 2024 | National Park Service | Rep/Lean Rep | 75 | 8 | 16 |
| 2025 | National Park Service | Rep/Lean Rep | 78 | 10 | 13 |
| 2026 | National Park Service | Rep/Lean Rep | 76 | 8 | 16 |
| 2023 | National Park Service | Dem/Lean Dem | 84 | 4 | 12 |
| 2024 | National Park Service | Dem/Lean Dem | 80 | 5 | 15 |
| 2025 | National Park Service | Dem/Lean Dem | 79 | 7 | 13 |
| 2026 | National Park Service | Dem/Lean Dem | 74 | 10 | 15 |
Note: No answer responses are not shown.
Source: Survey of U.S. adults conducted Sept. 28-Oct. 4, 2026.
PEW RESEARCH CENTER
National Weather Service
Views of the National Weather Service are also overwhelmingly positive in both parties, though somewhat less so than last year.
Overwhelming shares of Republicans and Democrats view the National Weather Service favorably
% who have a(n) __ opinion of the National Weather Service

Note: No answer responses are not shown.
Source: Survey of U.S. adults conducted Sept. 28-Oct. 4, 2026.
PEW RESEARCH CENTER
Overwhelming shares of Republicans and Democrats view the National Weather Service favorably
% who have a(n) __ opinion of the National Weather Service
| Year | Agency | Group | Favorable | Unfavorable | Not sure |
|---|---|---|---|---|---|
| 2025 | National Weather Service | Total | 76 | 11 | 13 |
| 2026 | National Weather Service | Total | 72 | 13 | 15 |
| 2025 | National Weather Service | Rep/Lean Rep | 75 | 14 | 11 |
| 2026 | National Weather Service | Rep/Lean Rep | 70 | 13 | 16 |
| 2025 | National Weather Service | Dem/Lean Dem | 81 | 8 | 11 |
| 2026 | National Weather Service | Dem/Lean Dem | 75 | 13 | 12 |
Note: No answer responses are not shown.
Source: Survey of U.S. adults conducted Sept. 28-Oct. 4, 2026.
PEW RESEARCH CENTER
Postal Service
Wide majorities in both parties view the Postal Service favorably, though views are less positive than they were a few years ago.
Most Americans view Postal Service favorably, including those in both parties
% who have a(n) __ opinion of the U.S. Postal Service

Note: No answer responses are not shown.
Source: Survey of U.S. adults conducted Sept. 28-Oct. 4, 2026.
PEW RESEARCH CENTER
Most Americans view Postal Service favorably, including those in both parties
% who have a(n) __ opinion of the U.S. Postal Service
| Year | Agency | Group | Favorable | Unfavorable | Not sure |
|---|---|---|---|---|---|
| 2023 | U.S. Postal Service | Total | 77 | 20 | 3 |
| 2024 | U.S. Postal Service | Total | 72 | 21 | 6 |
| 2025 | U.S. Postal Service | Total | 69 | 23 | 8 |
| 2026 | U.S. Postal Service | Total | 68 | 22 | 10 |
| 2023 | U.S. Postal Service | Rep/Lean Rep | 73 | 25 | 2 |
| 2024 | U.S. Postal Service | Rep/Lean Rep | 68 | 27 | 5 |
| 2025 | U.S. Postal Service | Rep/Lean Rep | 63 | 31 | 6 |
| 2026 | U.S. Postal Service | Rep/Lean Rep | 66 | 27 | 7 |
| 2023 | U.S. Postal Service | Dem/Lean Dem | 82 | 15 | 3 |
| 2024 | U.S. Postal Service | Dem/Lean Dem | 76 | 17 | 6 |
| 2025 | U.S. Postal Service | Dem/Lean Dem | 76 | 16 | 8 |
| 2026 | U.S. Postal Service | Dem/Lean Dem | 71 | 19 | 9 |
Note: No answer responses are not shown.
Source: Survey of U.S. adults conducted Sept. 28-Oct. 4, 2026.
PEW RESEARCH CENTER
This fact sheet was compiled by Research Analyst Andy Cerda. Director of Political Research Jocelyn Kiley, Associate Director Steven Shepard, Research Analyst Shanay Gracia, Senior Editorial Specialist David Kent, Associate Information Graphics Designer Carson TerBush and Digital Producer Sara Atske also provided assistance.