The ongoing shutdown of major pieces of the federal government has meant missed paychecks for federal workers, no new loans from the Small Business Administration, no giant panda cam from the National Zoo – and no jobs data from the federal Bureau of Labor Statistics, or BLS.
Federal economic data historically has been considered the gold standard, and the BLS’s monthly report on national employment and unemployment is a key resource for policymakers, economists, investors and others. It helps businesses decide whether to invest or pull back, the Federal Reserve decide to raise or lower interest rates, and much more.
Without BLS’s reports, many economy watchers turn to other indicators to get a sense of the nation’s labor markets. One alternative is the national employment report from Automatic Data Processing Inc., or ADP.
ADP is one of the nation’s largest human resources technology companies. Its business includes processing payrolls for more than 500,000 U.S. employers covering some 26 million workers. That’s roughly a fifth of the country’s private sector workforce.
ADP’s data is on a large enough scale that, until recently, the company provided some of it to the Federal Reserve for a more immediate sense of economic conditions. Using that data trove, ADP produces its employment report in collaboration with Stanford University’s Digital Economy Lab.
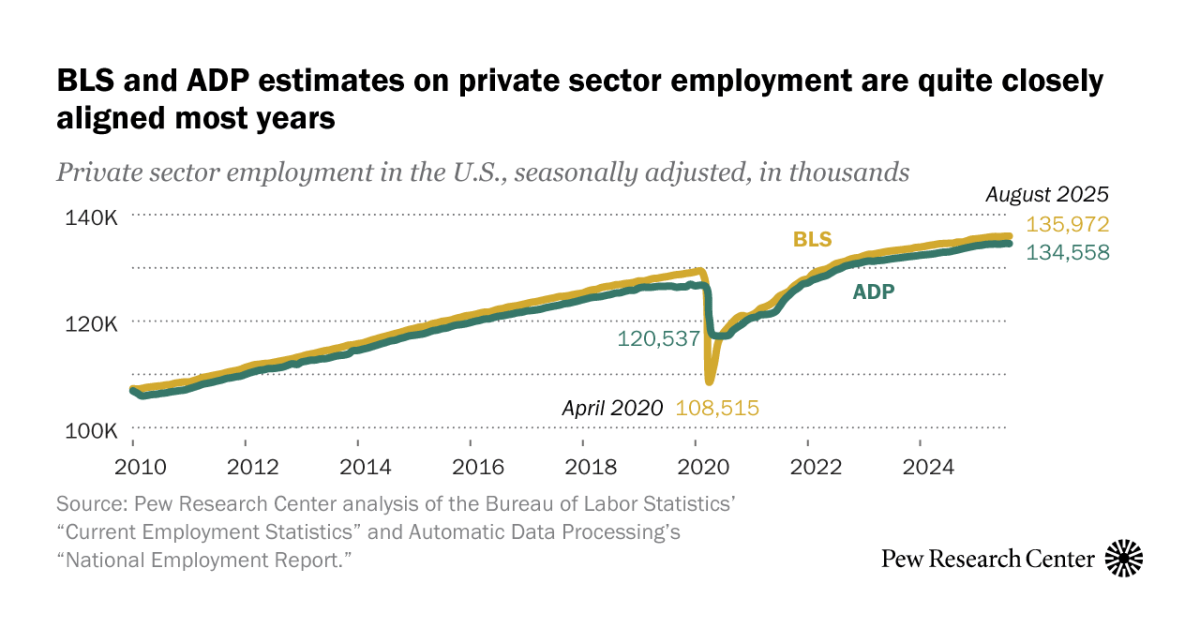
How do BLS and ADP employment figures compare?
BLS and ADP estimates on private sector employment are quite closely aligned most years
Private sector employment in the U.S., seasonally adjusted, in thousands
Note: Seasonal adjustment prevents data misinterpretation by adjusting for predictable events, such as holidays or seasonal changes in employment numbers.
Source: Pew Research Center analysis of the Bureau of Labor Statistics’ “Current Employment Statistics” and Automatic Data Processing’s “National Employment Report.”
PEW RESEARCH CENTER
BLS and ADP estimates on private sector employment are quite closely aligned most years
Private sector employment in the U.S., seasonally adjusted, in thousands
| Date | ADP | BLS |
|---|---|---|
| 1/2010 | 106,884 | 107,311 |
| 2/2010 | 106,401 | 107,229 |
| 3/2010 | 105,935 | 107,347 |
| 4/2010 | 106,029 | 107,551 |
| 5/2010 | 106,189 | 107,647 |
| 6/2010 | 106,258 | 107,769 |
| 7/2010 | 106,410 | 107,846 |
| 8/2010 | 106,509 | 107,996 |
| 9/2010 | 106,685 | 108,095 |
| 10/2010 | 106,814 | 108,324 |
| 11/2010 | 106,944 | 108,462 |
| 12/2010 | 107,047 | 108,564 |
| 1/2011 | 107,306 | 108,579 |
| 2/2011 | 107,582 | 108,841 |
| 3/2011 | 107,842 | 109,090 |
| 4/2011 | 108,162 | 109,413 |
| 5/2011 | 108,326 | 109,575 |
| 6/2011 | 108,516 | 109,767 |
| 7/2011 | 108,736 | 109,944 |
| 8/2011 | 108,947 | 110,108 |
| 9/2011 | 109,224 | 110,361 |
| 10/2011 | 109,351 | 110,555 |
| 11/2011 | 109,539 | 110,719 |
| 12/2011 | 109,665 | 110,934 |
| 1/2012 | 109,982 | 111,299 |
| 2/2012 | 110,298 | 111,561 |
| 3/2012 | 110,533 | 111,805 |
| 4/2012 | 110,768 | 111,894 |
| 5/2012 | 110,874 | 112,022 |
| 6/2012 | 111,085 | 112,082 |
| 7/2012 | 111,101 | 112,244 |
| 8/2012 | 111,223 | 112,422 |
| 9/2012 | 111,377 | 112,592 |
| 10/2012 | 111,681 | 112,765 |
| 11/2012 | 111,979 | 112,942 |
| 12/2012 | 111,848 | 113,187 |
| 1/2013 | 112,307 | 113,388 |
| 2/2013 | 112,487 | 113,664 |
| 3/2013 | 112,653 | 113,819 |
| 4/2013 | 112,696 | 114,004 |
| 5/2013 | 112,884 | 114,231 |
| 6/2013 | 112,937 | 114,439 |
| 7/2013 | 113,112 | 114,576 |
| 8/2013 | 113,361 | 114,815 |
| 9/2013 | 113,535 | 114,986 |
| 10/2013 | 113,625 | 115,211 |
| 11/2013 | 113,847 | 115,473 |
| 12/2013 | 114,427 | 115,553 |
| 1/2014 | 114,499 | 115,747 |
| 2/2014 | 114,719 | 115,887 |
| 3/2014 | 114,908 | 116,152 |
| 4/2014 | 115,181 | 116,444 |
| 5/2014 | 115,450 | 116,680 |
| 6/2014 | 115,736 | 116,954 |
| 7/2014 | 115,982 | 117,172 |
| 8/2014 | 116,274 | 117,414 |
| 9/2014 | 116,419 | 117,666 |
| 10/2014 | 116,721 | 117,880 |
| 11/2014 | 116,952 | 118,158 |
| 12/2014 | 117,219 | 118,417 |
| 1/2015 | 117,345 | 118,608 |
| 2/2015 | 117,471 | 118,849 |
| 3/2015 | 117,609 | 118,953 |
| 4/2015 | 117,873 | 119,191 |
| 5/2015 | 118,183 | 119,526 |
| 6/2015 | 118,328 | 119,694 |
| 7/2015 | 118,573 | 119,941 |
| 8/2015 | 118,716 | 120,065 |
| 9/2015 | 119,022 | 120,235 |
| 10/2015 | 119,251 | 120,523 |
| 11/2015 | 119,353 | 120,727 |
| 12/2015 | 119,499 | 120,980 |
| 1/2016 | 119,718 | 121,096 |
| 2/2016 | 119,968 | 121,269 |
| 3/2016 | 120,126 | 121,484 |
| 4/2016 | 120,372 | 121,671 |
| 5/2016 | 120,421 | 121,701 |
| 6/2016 | 120,685 | 121,966 |
| 7/2016 | 120,896 | 122,231 |
| 8/2016 | 121,019 | 122,378 |
| 9/2016 | 121,199 | 122,644 |
| 10/2016 | 121,356 | 122,771 |
| 11/2016 | 121,571 | 122,906 |
| 12/2016 | 121,677 | 123,104 |
| 1/2017 | 121,905 | 123,312 |
| 2/2017 | 121,991 | 123,522 |
| 3/2017 | 122,097 | 123,640 |
| 4/2017 | 122,244 | 123,839 |
| 5/2017 | 122,485 | 124,033 |
| 6/2017 | 122,674 | 124,223 |
| 7/2017 | 122,839 | 124,398 |
| 8/2017 | 123,004 | 124,609 |
| 9/2017 | 123,250 | 124,674 |
| 10/2017 | 123,359 | 124,789 |
| 11/2017 | 123,569 | 124,994 |
| 12/2017 | 123,783 | 125,139 |
| 1/2018 | 124,027 | 125,286 |
| 2/2018 | 124,253 | 125,635 |
| 3/2018 | 124,444 | 125,853 |
| 4/2018 | 124,526 | 125,978 |
| 5/2018 | 124,636 | 126,291 |
| 6/2018 | 124,843 | 126,477 |
| 7/2018 | 125,014 | 126,584 |
| 8/2018 | 125,258 | 126,811 |
| 9/2018 | 125,336 | 126,884 |
| 10/2018 | 125,591 | 127,047 |
| 11/2018 | 125,786 | 127,144 |
| 12/2018 | 125,808 | 127,298 |
| 1/2019 | 126,217 | 127,551 |
| 2/2019 | 126,376 | 127,540 |
| 3/2019 | 126,340 | 127,726 |
| 4/2019 | 126,393 | 127,974 |
| 5/2019 | 126,505 | 128,059 |
| 6/2019 | 126,520 | 128,235 |
| 7/2019 | 126,555 | 128,364 |
| 8/2019 | 126,558 | 128,546 |
| 9/2019 | 126,367 | 128,712 |
| 10/2019 | 126,443 | 128,790 |
| 11/2019 | 126,463 | 128,959 |
| 12/2019 | 126,910 | 129,069 |
| 1/2020 | 126,626 | 129,250 |
| 2/2020 | 126,733 | 129,435 |
| 3/2020 | 126,631 | 128,068 |
| 4/2020 | 120,537 | 108,515 |
| 5/2020 | 117,310 | 111,647 |
| 6/2020 | 117,202 | 116,259 |
| 7/2020 | 117,184 | 117,741 |
| 8/2020 | 117,294 | 118,819 |
| 9/2020 | 118,220 | 119,841 |
| 10/2020 | 118,860 | 120,656 |
| 11/2020 | 119,428 | 121,048 |
| 12/2020 | 120,141 | 120,870 |
| 1/2021 | 120,591 | 121,134 |
| 2/2021 | 120,782 | 121,658 |
| 3/2021 | 121,185 | 122,390 |
| 4/2021 | 121,239 | 122,702 |
| 5/2021 | 121,363 | 123,122 |
| 6/2021 | 121,715 | 123,824 |
| 7/2021 | 122,729 | 124,704 |
| 8/2021 | 123,976 | 125,147 |
| 9/2021 | 124,871 | 125,632 |
| 10/2021 | 125,666 | 126,526 |
| 11/2021 | 126,264 | 127,162 |
| 12/2021 | 126,962 | 127,707 |
| 1/2022 | 127,179 | 127,950 |
| 2/2022 | 127,710 | 128,834 |
| 3/2022 | 127,987 | 129,304 |
| 4/2022 | 128,311 | 129,572 |
| 5/2022 | 128,556 | 129,789 |
| 6/2022 | 129,051 | 130,229 |
| 7/2022 | 129,556 | 130,767 |
| 8/2022 | 129,879 | 131,017 |
| 9/2022 | 130,323 | 131,233 |
| 10/2022 | 130,541 | 131,604 |
| 11/2022 | 130,762 | 131,836 |
| 12/2022 | 130,884 | 131,963 |
| 1/2023 | 131,131 | 132,288 |
| 2/2023 | 131,288 | 132,538 |
| 3/2023 | 131,235 | 132,586 |
| 4/2023 | 131,367 | 132,753 |
| 5/2023 | 131,419 | 132,919 |
| 6/2023 | 131,565 | 133,089 |
| 7/2023 | 131,703 | 133,199 |
| 8/2023 | 131,822 | 133,307 |
| 9/2023 | 131,917 | 133,396 |
| 10/2023 | 132,047 | 133,513 |
| 11/2023 | 132,147 | 133,610 |
| 12/2023 | 132,242 | 133,823 |
| 1/2024 | 132,371 | 133,896 |
| 2/2024 | 132,462 | 134,047 |
| 3/2024 | 132,544 | 134,216 |
| 4/2024 | 132,657 | 134,345 |
| 5/2024 | 132,821 | 134,505 |
| 6/2024 | 132,957 | 134,571 |
| 7/2024 | 132,999 | 134,611 |
| 8/2024 | 133,179 | 134,644 |
| 9/2024 | 133,373 | 134,852 |
| 10/2024 | 133,594 | 134,851 |
| 11/2024 | 133,798 | 135,095 |
| 12/2024 | 133,974 | 135,382 |
| 1/2025 | 134,160 | 135,461 |
| 2/2025 | 134,244 | 135,568 |
| 3/2025 | 134,391 | 135,682 |
| 4/2025 | 134,451 | 135,815 |
| 5/2025 | 134,480 | 135,884 |
| 6/2025 | 134,457 | 135,857 |
| 7/2025 | 134,561 | 135,934 |
| 8/2025 | 134,558 | 135,972 |
Note: Seasonal adjustment prevents data misinterpretation by adjusting for predictable events, such as holidays or seasonal changes in employment numbers.
Source: Pew Research Center analysis of the Bureau of Labor Statistics’ “Current Employment Statistics” and Automatic Data Processing’s “National Employment Report.”
PEW RESEARCH CENTER
We calculated a statistic called the coefficient of determination, also known as R2, to gauge how similar the BLS and ADP private sector data series are. R2 ranges from zero to one; the higher the value, the closer the two series are. (For a more detailed explanation, read the “How we did this” section.)
Statistics on private sector jobs from ADP and BLS are highly correlated. Since the start of ADP’s series in 2010, the R2 for the two national private sector employment reports is 0.9817 (when adjusted to account for seasonal variations) and 0.9771 (not seasonally adjusted).
Beyond those headline numbers, both ADP and BLS break down their employment data into smaller categories. We compared three subseries that both entities use – workforce size, region and industry – and found most of them were strongly correlated as well.
From the smallest businesses (one to 19 employees) to the largest (500 or more employees), the R2 scores for workforce size are all well above 0.98 (not seasonally adjusted). All nine Census regions have scores above 0.87 (in both their seasonally adjusted and unadjusted versions), and five are above 0.97.
Seven of the 10 industry groups have R2 scores above 0.9 (seasonally adjusted and unadjusted). The leisure and hospitality industry is close behind, at above 0.8 for unadjusted and adjusted.
Two industries – mining/logging/natural resources and “other services” – are considerably less correlated, likely because ADP and BLS define them differently.
There are other key differences in how the two entities produce their reports. The BLS jobs report comes from two surveys: one of 60,000 households (which generates the unemployment rate) and the other of 121,000 business establishments (which generates the payroll employment figures). ADP bases its report on anonymized, aggregated payroll data from its clients. It measures job growth or shrinkage by comparing employers’ payrolls in a given pay period with those from the previous pay period.
Those differences mean the ADP data can’t perfectly substitute the BLS data. For one thing, the ADP data isn’t representative of the entire economy; the company’s client base tilts more toward mid-sized businesses than the BLS employer survey does. The ADP data also excludes government workers entirely and doesn’t allow as detailed of an analysis as the BLS datasets. (If you want to know how many leisure and hospitality jobs there are in Athens, Georgia, the BLS is where you want to go.)
But the two data series share some important similarities. Both use the week that includes the 12th of each month as their monthly reference point (though ADP releases new data weekly). And both use the BLS’s Quarterly Census of Employment and Wages, or QCEW, to benchmark and revise their monthly estimates. The QCEW comes from employers’ unemployment tax filings and covers more than 95% of all U.S. jobs. But it has a time lag of several months and was last published in September (covering the first quarter of 2025).
In general, the BLS tends to estimate that there are somewhat more private sector payroll jobs than ADP. And in any given month, the two indicators may point in different directions or show greater or lesser month-over-month changes. (This was particularly true in the early days of the COVID-19 pandemic, when the BLS jobs figure fell more precipitously than ADP’s.)
Employment figures are by no means the only government economic data affected by the shutdown. The BLS produces monthly readings on consumer prices, job openings and layoffs, and other closely watched economic reports, all of which have been disrupted. (The bureau did release its inflation report for September, but only after a nine-day delay.)
Other important federal agencies that produce economic data, such as the Bureau of Economic Analysis and the Census Bureau, aren’t generating or releasing any new data either. Even after the government fully reopens, data releases likely will take some time to get back on schedule.
Most ADP and BLS jobs categories are very similar
| R2, Not seasonally adjusted | R2, Seasonally adjusted | |
|---|---|---|
| INDUSTRY GROUPS: | ||
| Professional & business services | 0.9907 | 0.9907 |
| Trade, transportation & utilities | 0.9769 | 0.9875 |
| Financial | 0.9759 | 0.9878 |
| Construction | 0.9733 | 0.9944 |
| Education & health care | 0.9713 | 0.9846 |
| Manufacturing | 0.9676 | 0.9692 |
| Information | 0.9332 | 0.9563 |
| Leisure & hospitality | 0.8491 | 0.8697 |
| Mining, logging & natural resources | 0.7034 | 0.7210 |
| Other services | 0.5449 | 0.5353 |
| CENSUS DIVISION: | ||
| Mountain | 0.9932 | 0.9949 |
| West South Central | 0.9865 | 0.9925 |
| South Atlantic | 0.9856 | 0.9901 |
| Pacific | 0.9719 | 0.9761 |
| East South Central | 0.9709 | 0.9827 |
| West North Central | 0.9416 | 0.9559 |
| East North Central | 0.9202 | 0.9226 |
| Mid-Atlantic | 0.8854 | 0.8935 |
| New England | 0.8763 | 0.8825 |
| ESTABLISHMENT SIZE: | ||
| 1 to 19 employees | 0.9934 | — |
| 20 to 49 employees | 0.9844 | — |
| 50 to 249 employees | 0.9859 | — |
| 250 to 499 employees | 0.9936 | — |
| 500 or more employees | 0.9923 | — |
Note: The R2 statistic indicates how closely the ADP data predicts (or aligns with) the BLS data. The value ranges between 0 and 1 – the closer to 1, the more similar the two series are.
Source: Pew Research Center analysis of the Bureau of Labor Statistics’ “Current Employment Statistics” and Automatic Data Processing’s “National Employment Report.”