

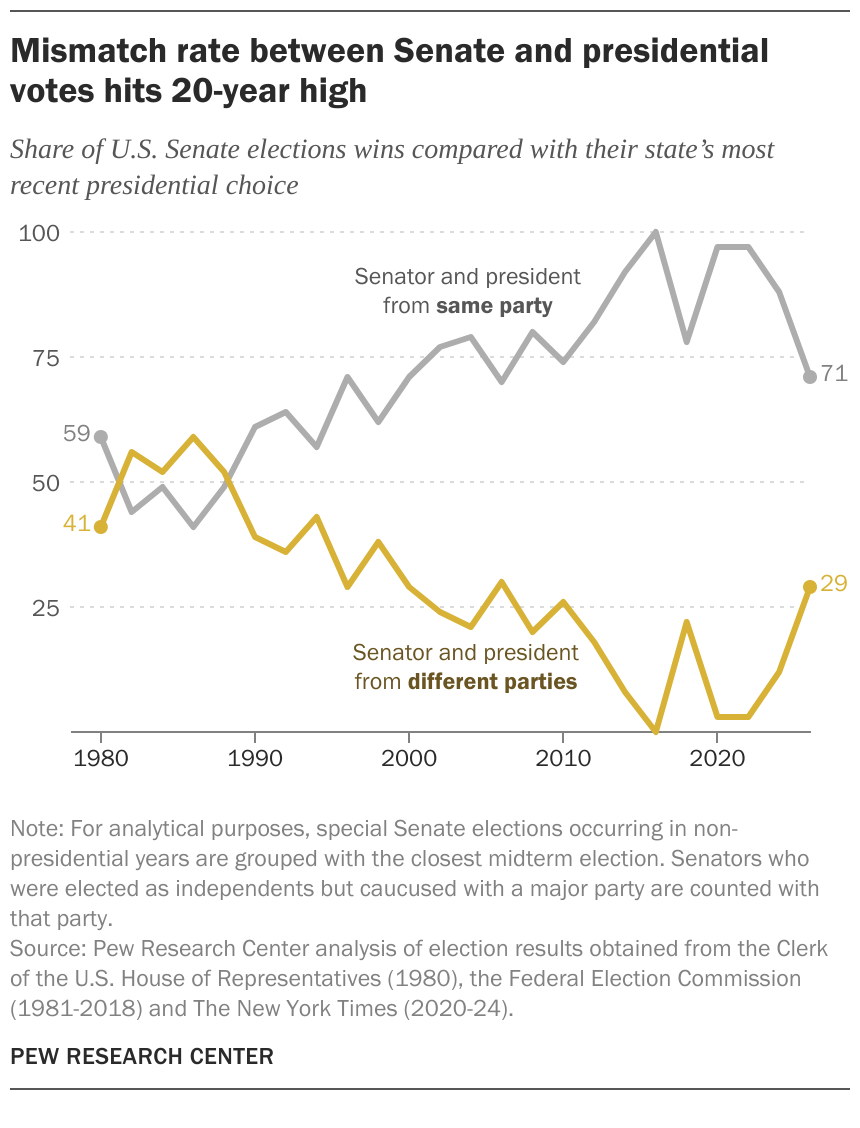
Voters in 10 states that voted for Republican Donald Trump in 2024 elected Democratic senators this year. That’s the highest “mismatch rate” between states’ Senate and presidential votes in two decades, according to a Pew Research Center analysis of election results.
Mismatch rate between Senate and presidential votes hits 20-year high
Share of U.S. Senate elections wins compared with their state’s most recent presidential choice
Note: For analytical purposes, special Senate elections occurring in non-presidential years are grouped with the closest midterm election. Senators who were elected as independents but caucused with a major party are counted with that party.
Source: Pew Research Center analysis of election results obtained from the Clerk of the U.S. House of Representatives (1980), the Federal Election Commission (1981-2018) and The New York Times (2020-24).
PEW RESEARCH CENTER
Mismatch rate between Senate and presidential votes hits 20-year high
Share of U.S. Senate elections wins compared with their state’s most recent presidential choice
| Midterm year | Senator and president from same party | Senator and president from different parties |
|---|---|---|
| 1980 | 59% | 41% |
| 1982 | 44% | 56% |
| 1984 | 49% | 52% |
| 1986 | 41% | 59% |
| 1988 | 49% | 52% |
| 1990 | 61% | 39% |
| 1992 | 64% | 36% |
| 1994 | 57% | 43% |
| 1996 | 71% | 29% |
| 1998 | 62% | 38% |
| 2000 | 71% | 29% |
| 2002 | 77% | 24% |
| 2004 | 79% | 21% |
| 2006 | 70% | 30% |
| 2008 | 80% | 20% |
| 2010 | 74% | 26% |
| 2012 | 82% | 18% |
| 2014 | 92% | 8% |
| 2016 | 100% | 0% |
| 2018 | 78% | 22% |
| 2020 | 97% | 3% |
| 2022 | 97% | 3% |
| 2024 | 88% | 12% |
| 2026 | 71% | 29% |
Note: For analytical purposes, special Senate elections occurring in non-presidential years are grouped with the closest midterm election. Senators who were elected as independents but caucused with a major party are counted with that party.
Source: Pew Research Center analysis of election results obtained from the Clerk of the U.S. House of Representatives (1980), the Federal Election Commission (1981-2018) and The New York Times (2020-24).
PEW RESEARCH CENTER
Overall, 35 Senate seats were on the ballot this year, meaning that 28.6% of them didn’t go the same way their states did two years ago. In 2006, 10 of the 33 Senate seats up for election that year (30.3%) were mismatches.
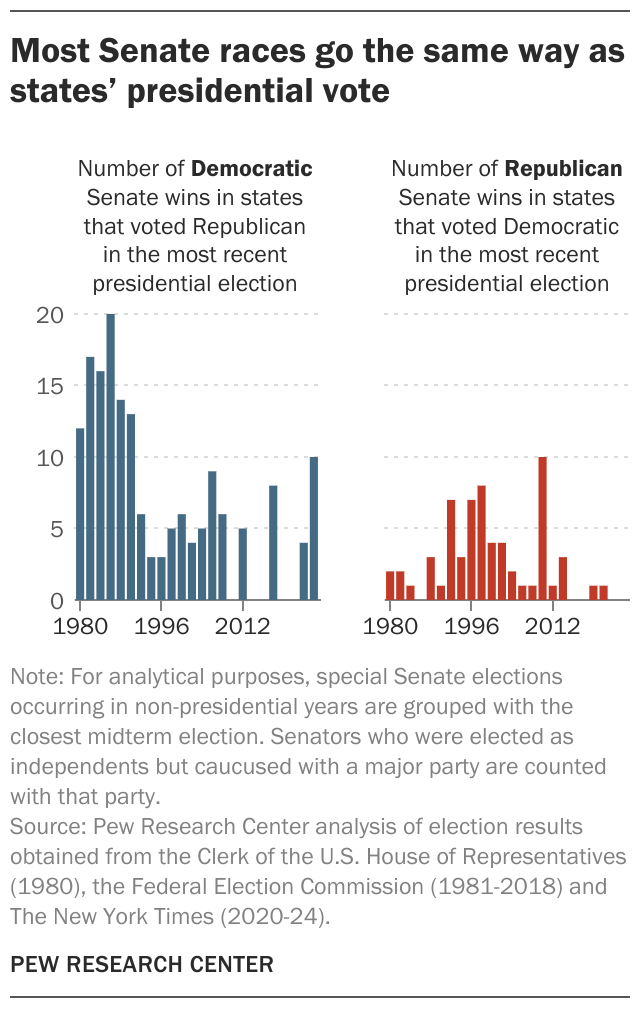
No states this year mismatched the other way – that is, elected a Republican senator after voting for Democrat Kamala Harris in 2024.
Senate-president mismatches of this sort used to be fairly common – particularly in midterm elections, when voters pick congressional candidates without choosing a president at the same time.
Back in the 1980s when our analysis begins, the mismatch rate consistently approached or exceeded 50%. Democrats regularly won Senate seats in states Republican Ronald Reagan carried in his two landslide presidential victories.
Most Senate races go the same way as states’ presidential vote
Note: For analytical purposes, special Senate elections occurring in non-presidential years are grouped with the closest midterm election. Senators who were elected as independents but caucused with a major party are counted with that party.
Source: Pew Research Center analysis of election results obtained from the Clerk of the U.S. House of Representatives (1980), the Federal Election Commission (1981-2018) and The New York Times (2020-24).
PEW RESEARCH CENTER
Most Senate races go the same way as states’ presidential vote
| Midterm year | Election years (including special elections) | Democratic Senate wins in states that voted Republican in most recent presidential election | Republican Senate wins in states that voted Democratic in most recent presidential election |
|---|---|---|---|
| 1980 | 1980 | 12 | 2 |
| 1982 | 1982-83 | 17 | 2 |
| 1984 | 1984 | 16 | 1 |
| 1986 | 1986 | 20 | 0 |
| 1988 | 1988 | 14 | 3 |
| 1990 | 1990-91 | 13 | 1 |
| 1992 | 1992 | 6 | 7 |
| 1994 | 1993-Jan. 96 | 3 | 3 |
| 1996 | 1996 | 3 | 7 |
| 1998 | 1998 | 5 | 8 |
| 2000 | 2000 | 6 | 4 |
| 2002 | 2002 | 4 | 4 |
| 2004 | 2004 | 5 | 2 |
| 2006 | 2006 | 9 | 1 |
| 2008 | 2008 | 6 | 1 |
| 2010 | 2010 | 0 | 10 |
| 2012 | 2012 | 5 | 1 |
| 2014 | 2013-14 | 0 | 3 |
| 2016 | 2016 | 0 | 0 |
| 2018 | 2017-18 | 8 | 0 |
| 2020 | 2020-21 | 0 | 1 |
| 2022 | 2022 | 0 | 1 |
| 2024 | 2024 | 4 | 0 |
| 2026 | 2026 | 10 | 0 |
Note: For analytical purposes, special Senate elections occurring in non-presidential years are grouped with the closest midterm election. Senators who were elected as independents but caucused with a major party are counted with that party.
Source: Pew Research Center analysis of election results obtained from the Clerk of the U.S. House of Representatives (1980), the Federal Election Commission (1981-2018) and The New York Times (2020-24).
PEW RESEARCH CENTER
But since the mid-1990s, the mismatch rate has never exceeded 40% and frequently has been much lower. In 2016, every state’s Senate race went the same way as its presidential pick. In both the 2020-21 and 2022 election cycles, there was only one such mismatch.
Since 2016, in fact, 88.5% of all Senate contests (185 of 209) have been won by candidates from the party that won their state’s most recent presidential race. This includes both regular and special elections. (Independents are counted with the party they caucus with or get their committee assignments from.)
Before this year, the last time the Senate/presidential mismatch rate topped 20% was in 2017-18. Over that election cycle, there were eight mismatches out of 36 regular and special Senate elections, for a mismatch rate of 22.2%. As was the case this year and in 2024, all of those mismatches were Democratic victories in states Trump had carried in the previous presidential race.
Many of the recent upticks in mismatches have been the result of so-called “wave” elections, particularly midterms in which the party that lost the White House two years earlier rebounded in Congress:
- 2017-18: 8 total mismatches (all Democratic wins)
- 2010: 10 total mismatches (all Republican wins)
- 2006: 10 total mismatches (9 Democratic wins, 1 Republican)
Note: This is an update of a post originally published June 26, 2018.