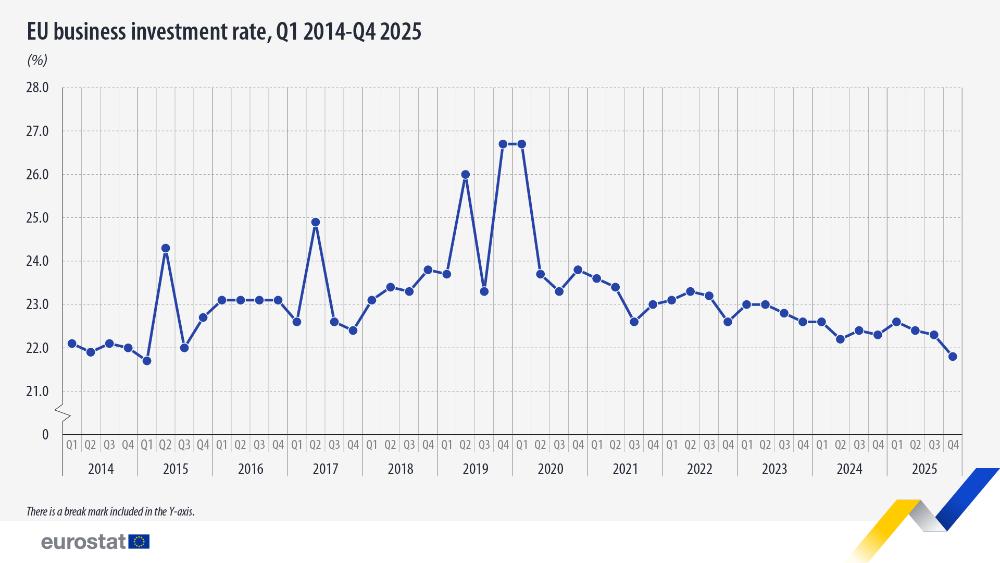
In the fourth quarter of 2025, the EU business investment rate reached 21.8%, the lowest point since the third quarter of 2015.
Since 2014, the EU’s non-financial corporation investment rate has shown 2 clear trends, with notable spikes. Between 2014 and 2018, the investment rate rose steadily from 22% to nearly 24%. Yet from 2021 onwards, it has fallen almost continuously, hitting 21.8% in the fourth quarter of 2025. The sharp increases in the second quarter of 2015, 2017 and 2019, followed by a similar trend in the fourth quarter of 2019 and the first quarter of 2020, were largely due to surges in intellectual property imports of certain countries, driven by globalisation dynamics.
Source dataset: nasq_10_ki
Highest EU business investment rate in Hungary, lowest in Luxembourg
At the national level, the latest available data is for 2024, when the highest EU business investment rates were recorded in Hungary (28.4%), Croatia (28.3%), Czechia (27.6%), Belgium (27.0%) and Sweden (26.9%). On the other hand, the lowest rates were in Luxembourg (15.9%), Ireland and Cyprus (both 16.0%), the Netherlands (16.7%) and Malta (16.8%).
Source dataset: nasa_10_ki
The business investment rate can be calculated from the values available in the sequence of accounts. This table allows you to discover the relationships between non-financial flows and financial stocks and flows in the economy among the various institutional sectors (corporations, government and households). You can pick a country (or the EU or the euro area as a whole), frequency (annual or quarterly) and period. The business investment rate, which relates to the non-financial corporations sector (S11), is calculated from gross fixed capital formation (P51G) from the ‘acquisition of non-financial assets’ account and gross value added (B1G) from the production account.