There’s no simple answer to the question “Who is Hispanic?” It depends on how Hispanics are counted in the decennial census and other surveys; how people understand their racial and ethnic identities; and whether people with Hispanic ancestry identify as Hispanic at all. Together, these factors can shape how the more than 70 million people who identify as Hispanic are understood today.
U.S. Hispanic population reached 70 million in 2025
Population of Hispanics in the United States, 1970-2025, in millions
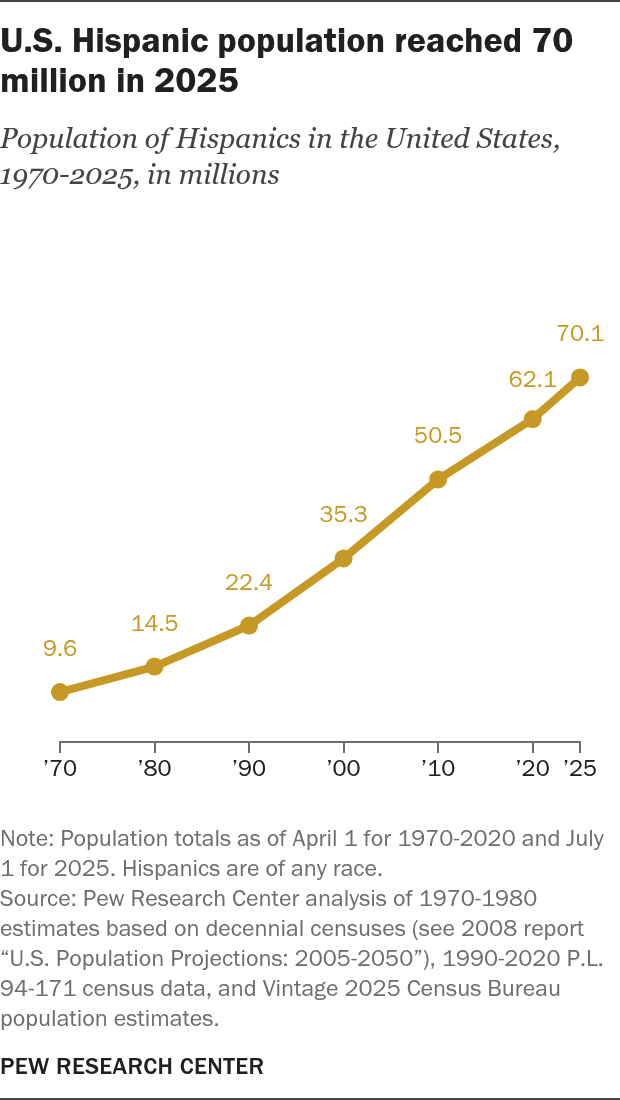
Note: Population totals as of April 1 for 1970-2020 and July 1 for 2025. Hispanics are of any race.
Source: Pew Research Center analysis of 1970-1980 estimates based on decennial censuses (see 2008 report “U.S. Population Projections: 2005-2050”), 1990-2020 P.L. 94-171 census data, and Vintage 2025 Census Bureau population estimates.
PEW RESEARCH CENTER
U.S. Hispanic population reached 70 million in 2025
Population of Hispanics in the United States, 1970-2025, in millions
| Total Hispanic population | |
|---|---|
| 2025 | 70.1 |
| 2020 | 62.1 |
| 2010 | 50.5 |
| 2000 | 35.3 |
| 1990 | 22.4 |
| 1980 | 14.5 |
| 1970 | 9.6 |
Note: Population totals as of April 1 for 1970-2020 and July 1 for 2025. Hispanics are of any race.
Source: Pew Research Center analysis of 1970-1980 estimates based on decennial censuses (see 2008 report “U.S. Population Projections: 2005-2050”), 1990-2020 P.L. 94-171 census data, and Vintage 2025 Census Bureau population estimates.
PEW RESEARCH CENTER
How the federal government defines ‘Hispanic’
Fifty years ago, Congress passed legislation requiring the government to collect and publish data on Americans of Spanish origin or descent. The law defined the group as Americans who “identify themselves as being of Spanish-speaking background and trace their origin or descent from Mexico, Puerto Rico, Cuba, Central and South America, and other Spanish-speaking countries.” The population described in the law is today known as “Hispanic or Latino.”
How Hispanics are identified and counted
The federal government’s definition of Hispanic establishes broad boundaries. But government agencies and survey organizations still must decide how to classify individual responses. They don’t do so in the same way.
Most surveys count someone as Hispanic if they identify that way, without exception – that is, you are Hispanic if you say you are. Pew Research Center uses this approach, as do Gallup and national voter exit polls.
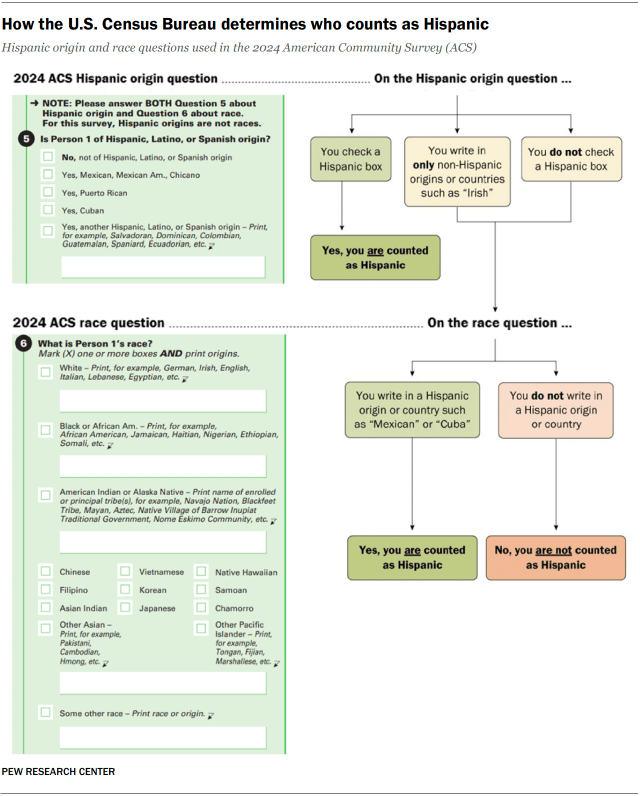
The Census Bureau generally takes the same approach, but with some exceptions. For example, if someone only selects the “Other Hispanic” category and writes in only a non-Hispanic response – “Irish,” for example – the bureau recodes the response as non-Hispanic. Conversely, if someone says their race is “Mexican” or “Costa Rican” but don’t check the Hispanic box, they’re counted as Hispanic.
Are Brazilians, Portuguese, Belizeans and Filipinos considered Hispanic?
Officially, Brazilians are not considered Hispanic or Latino because the federal government’s definition applies only to people of “Spanish culture or origin.” In most cases, respondents who report their Hispanic or Latino ethnicity as Brazilian in Census Bureau surveys are later recategorized – or “back coded” – as not Hispanic or Latino. The same is true for people with origins in Belize, the Philippines and Portugal.
The Census Bureau’s 2020 American Community Survey (ACS) provided a rare window into the difference between how people identify versus how their responses are coded. Due to an error in how the Census Bureau processed data from the ACS that year, at least 416,000 Brazilians — more than two-thirds of all Brazilians in the U.S. – were counted as Hispanic or Latino, compared with only 14,000 the year before and 16,000 the year after.
How Hispanics identify their race
Under federal standards, Hispanics can be of any race, as “Hispanic” is considered an ethnicity, not a race. While the federal government currently counts Hispanic origin separately from race, many Hispanics do not experience those identities separately.
The racial identity of Hispanics in 2024
Among U.S. Hispanics, in millions
Note: “Some other race” is a category for people who do not identify with the other race categories listed on the survey, especially Hispanic responses.
Source: Pew Research Center analysis of 2024 American Community Survey (IPUMS).
PEW RESEARCH CENTER
The racial identity of Hispanics in 2024
Among U.S. Hispanics, in millions
| Response | Category | |
|---|---|---|
| Multiple races | 29.4 | All |
| Among Hispanics who identify with a single race | ||
| Some other race | 23.4 | Race |
| White | 11.9 | Race |
| American Indian or Alaska Native | 1.7 | Race |
| Black | 1.2 | Race |
| Asian | 0.3 | Race |
| Native Hawaiian or Pacific Islander | 0.1 | Race |
Note: “Some other race” is a category for people who do not identify with the other race categories listed on the survey, especially Hispanic responses.
Source: Pew Research Center analysis of 2024 American Community Survey (IPUMS).
PEW RESEARCH CENTER
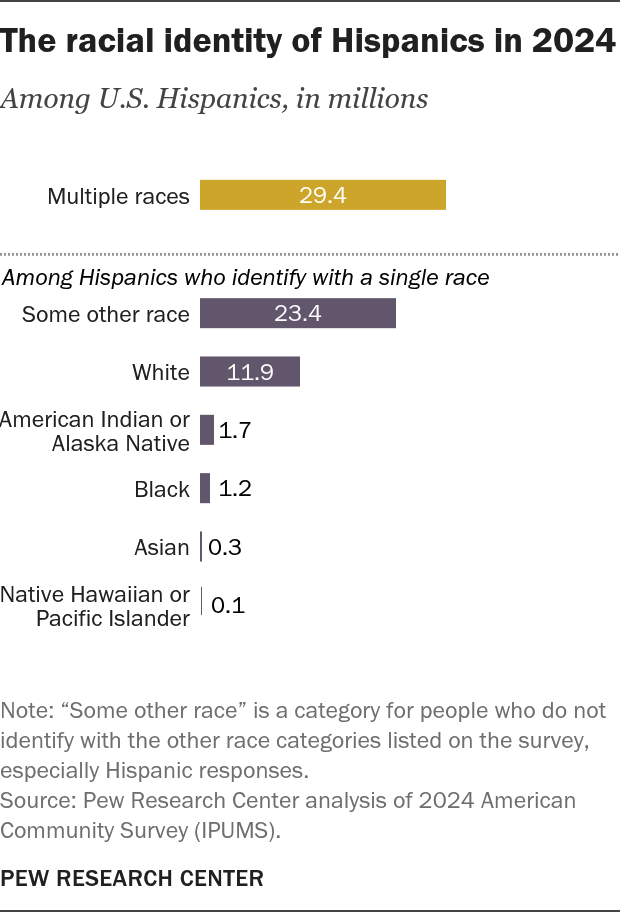
When asked about their race in the 2024 ACS, 23.4 million single-race Hispanics selected “some other race.” Most wrote in a Hispanic origin or nationality such as “Mexican” or “Latin American” or “Hispanic.” Another 11.9 million selected White, while fewer selected Native American, Black, Asian, or Native Hawaiian or Pacific Islander.
Another 29.4 million Hispanics were identified as being of more than one race in 2024, a total larger than any of the single-race groups. The multiracial Hispanic population has grown sharply since the 2010 census, when just 3 million selected two or more race categories.
Much of the increase in the number of Hispanics with multiple races likely reflects changes introduced with the 2020 census. These changes included more space for people to write in detailed racial or ethnic origins, as well as new coding decisions by the Census Bureau. In particular, the bureau’s decision to code any Hispanic response in the race question as “some other race” – regardless how many races the respondent selected – was probably a significant factor behind the increase, rather than a sudden change in the population’s ancestry or views of their own racial background.
Growth in the number of multiracial Hispanics has come primarily from those who identify as two races: White and “some other race.” That population grew from 1.6 million to 25.0 million between 2010 and 2024.
Beyond census racial categories
Census race categories capture only part of how Hispanics view and experience their race.
The role of skin color in Hispanic experiences
A majority of Latino adults (57%) say skin color shapes their daily life experiences at least some. Similar shares say having a lighter skin color helps Latinos get ahead in the U.S. (59%) and that having a darker skin color hurts Latinos’ ability to get ahead (62%), according to Pew Research Center’s 2021 National Survey of Latinos.
In surveys like those from the Census Bureau, skin color does not play a role in determining who is Hispanic or not. However, Hispanics can have many different skin tones.
In the 2021 survey, Latino adults were shown a palette of 10 skin colors and asked to choose the one they felt most closely matched their own. Eight-in-ten chose one of the four lightest tones, while 3% chose one of the four darkest.
Afro-Latino identity
Some people with African and Latin American heritage identify as Afro-Latino. It’s an identity deeply connected to the colonial history of Latin America, when millions of enslaved Africans were taken to Spanish and Portuguese colonies.
Afro-Latino identity can exist alongside a person’s Hispanic identity. But it can also be its own distinct identity shaped by race, skin tone and other factors. In our 2025 survey of Hispanic adults in the United States, 13% said they consider themselves Afro-Latino. At the same time, previous Center research has shown that some U.S. adults who identify as Afro-Latino do not also identify as Hispanic.
How Hispanics describe and define their identity
Pan-ethnic labels like “Hispanic” and “Latino” are widely used – sometimes interchangeably. However, they’re not universally embraced by the population being labeled.
Majority of Hispanic adults typically use their origin country to describe themselves
% of U.S. Hispanic adults who use __ most often to describe themselves
% of U.S. Hispanic adults who prefer the pan-ethnic term __ to describe people who are of Hispanic or Latino origin or descent
Note: Shares of respondents who didn’t offer an answer are not shown.
Source: National Survey of Latinos conducted Oct. 6-16, 2025.
PEW RESEARCH CENTER
Majority of Hispanic adults typically use their origin country to describe themselves
% of U.S. Hispanic adults who use __ most often to describe themselves
| Their origin/heritage, alone or combined with American (e.g., Mexican, Mexican American) | Hispanic/Latino/Latinx/Latine, alone or combined with American (e.g., Hispanic, Hispanic American) | American | ||
|---|---|---|---|---|
| All Hispanic adults | 53 | 27 | 18 | |
| % of U.S. Hispanic adults who prefer the pan-ethnic term __ to describe people who are of Hispanic or Latino origin or descent | ||||
| Hispanic | Latino | Latinx/Latine | No preference | |
| All Hispanic adults | 54 | 30 | 2 | 14 |
Note: Shares of respondents who didn’t offer an answer are not shown.
Source: National Survey of Latinos conducted Oct. 6-16, 2025.
PEW RESEARCH CENTER
When asked how they most often describe themselves, Hispanic adults are most likely to use their family’s national origin. Our 2025 National Survey of Latinos found:
- 53% of Hispanics describe themselves by their country of origin (either alone or combined with “American”).
- 27% use pan-ethnic terms like Hispanic, Latino, Latinx or Latine (either alone or combined with “American”).
- 18% most often describe themselves as only American.
When asked which pan-ethnic term they prefer to describe the population overall, 54% say Hispanic, 30% say Latino and 14% have no preference. Relatively few prefer Latinx or Latine – terms that have generated considerable public debate – to describe the group.
Language, parents and surnames
The labels people use are only one part of how they understand Hispanic identity. Hispanic adults also differ over whether characteristics like speaking Spanish, having Hispanic parents or having a Spanish surname are necessary to belong to the group.
How Hispanic identity may change over generations
The boundaries of Hispanic identity may become less distinct as intermarriage increases and as more Americans grow up with some – but not only – Hispanic ancestry.
In 2024, about a third of Hispanic newlyweds married someone who wasn’t Hispanic
% of U.S. newlyweds who married someone of a different race or ethnicity, 1980 and 2024
Note: Based on those married in the last year. White, Black and Asian include those who report being only one race and are not Hispanic; Asians in 1980 include Pacific Islanders. Hispanics are of any race.
Source: Pew Research Center analysis of 2024 American Community Survey and 1980 decennial census (IPUMS).
PEW RESEARCH CENTER
In 2024, about a third of Hispanic newlyweds married someone who wasn’t Hispanic
% of U.S. newlyweds who married someone of a different race or ethnicity, 1980 and 2024
| Hispanic | Asian | Black | White | |
|---|---|---|---|---|
| 1980 | 26 | 33 | 5 | 4 |
| 2024 | 32 | 32 | 25 | 16 |
| Among __ Hispanics, 2024 | ||||
| U.S. born | 44 | |||
| Immigrant | 15 |
Note: Based on those married in the last year. White, Black and Asian include those who report being only one race and are not Hispanic; Asians in 1980 include Pacific Islanders. Hispanics are of any race.
Source: Pew Research Center analysis of 2024 American Community Survey and 1980 decennial census (IPUMS).
PEW RESEARCH CENTER
Intermarriage
Today, many Hispanics are in families with people who aren’t Hispanic:
Spouses: Among married Hispanics who were living with their spouse in 2024, 23% had a spouse who was not Hispanic.
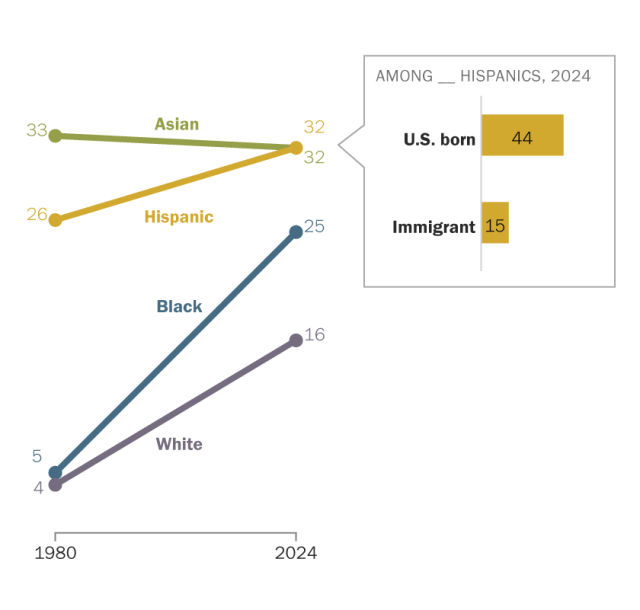
Newlyweds: In 2024, 32% of Hispanic newlyweds married someone who was not Hispanic. Among this group, 44% of those born in the U.S. married someone who wasn’t Hispanic, compared with 15% of immigrant newlyweds, according to an analysis of ACS data.
Hispanic ancestry doesn’t always translate into Hispanic identity
Among Americans with Hispanic ancestry, the share who identify as Hispanic or Latino declines across generations in the U.S.
% of U.S. adults in 2015-16 with Hispanic ancestry who …

Note: “Identify as Hispanic” includes those who say they are Hispanic. “Do not identify as Hispanic” includes those who say they are not Hispanic or Latino, but say they have Hispanic ancestry or heritage. “Second generation” refers to those born in the 50 states or the District of Columbia, to at least one immigrant parent. “Third generation” refers to those born in the 50 states or D.C., with both parents born in the 50 states or D.C and at least one immigrant grandparent. “Fourth or higher generation” refers to those born in the 50 states or D.C. with parents and all four grandparents born in the 50 states or D.C.
Source: Pew Research Center 2015 National Survey of Latinos (Oct. 21-Nov. 30, 2015) and survey of self-identified non-Hispanics with Hispanic ancestry or heritage only (Nov. 11, 2015-Feb. 7, 2016).
PEW RESEARCH CENTER
Among Americans with Hispanic ancestry, the share who identify as Hispanic or Latino declines across generations in the U.S.
% of U.S. adults in 2015-16 with Hispanic ancestry who …
| Do not identify as Hispanic | Identify as Hispanic | |
|---|---|---|
| Immigrant | 3 | 97 |
| Second generation | 8 | 92 |
| Third generation | 23 | 77 |
| Fourth or higher generation | 50 | 50 |
Note: “Identify as Hispanic” includes those who say they are Hispanic. “Do not identify as Hispanic” includes those who say they are not Hispanic or Latino, but say they have Hispanic ancestry or heritage. “Second generation” refers to those born in the 50 states or the District of Columbia, to at least one immigrant parent. “Third generation” refers to those born in the 50 states or D.C., with both parents born in the 50 states or D.C and at least one immigrant grandparent. “Fourth or higher generation” refers to those born in the 50 states or D.C. with parents and all four grandparents born in the 50 states or D.C.
Source: Pew Research Center 2015 National Survey of Latinos (Oct. 21-Nov. 30, 2015) and survey of self-identified non-Hispanics with Hispanic ancestry or heritage only (Nov. 11, 2015-Feb. 7, 2016).
PEW RESEARCH CENTER
Pew Research Center surveys in 2015-16 asked U.S. adults about both their ancestry and whether they identified as Hispanic. It found that 11% of adults with Hispanic ancestry, or about 5 million people, did not identify as Hispanic or Latino.
Hispanic self-identification tends to decline across generations in the U.S. Among immigrants from Latin America or Spain, nearly all identify as Hispanic. But by the fourth generation – that is, Americans whose grandparents were all born in the U.S. – only half of people with Hispanic ancestry identify as Hispanic.
Note: Here are the survey questions for this analysis, the detailed responses, and the survey methodology. This is an update of a post originally published on May 28, 2009. It was last updated on Sept. 12, 2024, by Mark Hugo Lopez, Jens Manuel Krogstad and Jeffrey S. Passel.