
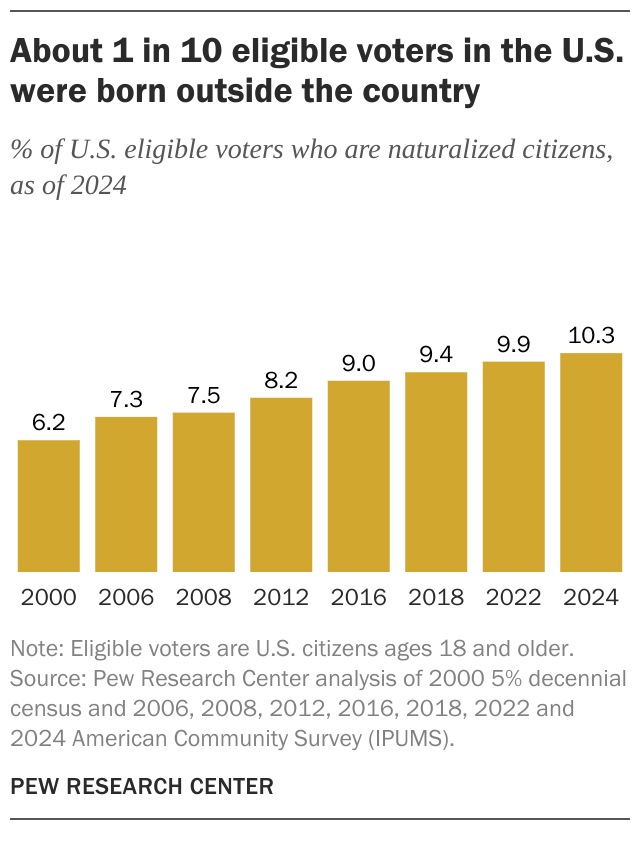
An estimated 250 million people in the United States are eligible to vote in this year’s midterm elections. Around one-in-ten of them – or 25 million – are naturalized citizens, according to a Pew Research Center analysis of U.S. Census Bureau data.
About 1 in 10 eligible voters in the U.S. were born outside the country
% of U.S. eligible voters who are naturalized citizens, as of 2024
Note: Eligible voters are U.S. citizens ages 18 and older.
Source: Pew Research Center analysis of 2000 5% decennial census and 2006, 2008, 2012, 2016, 2018, 2022 and 2024 American Community Survey (IPUMS).
PEW RESEARCH CENTER
About 1 in 10 eligible voters in the U.S. were born outside the country
% of U.S. eligible voters who are naturalized citizens, as of 2024
| Year | Number of eligible voters | Number of naturalized citizens who are eligible voters | Share of all eligible voters born in the U.S. | % | remainder |
|---|---|---|---|---|---|
| 2000 | 193379162 | 11980713 | 94 | 6.2 | 93.8 |
| 2006 | 7.3 | 92.7 | |||
| 2008 | 210695823 | 15740641 | 93 | 7.5 | 92.5 |
| 2012 | 220110869 | 17996609 | 92 | 8.2 | 91.8 |
| 2016 | 229009706 | 20604341 | 91 | 9.0 | 91.0 |
| 2018 | 233675046 | 22004882 | 91 | 9.4 | 90.6 |
| 2022 | 241343512 | 23812268 | 90 | 9.9 | 90.1 |
| 2024 | 245323452 | 25186235 | 90 | 10.3 | 89.7 |
Note: Eligible voters are U.S. citizens ages 18 and older.
Source: Pew Research Center analysis of 2000 5% decennial census and 2006, 2008, 2012, 2016, 2018, 2022 and 2024 American Community Survey (IPUMS).
PEW RESEARCH CENTER
Naturalized citizens are people who were born outside the U.S. and gained American citizenship through naturalization. They are generally eligible to vote if they are at least 18 years old, as is the case with people born in the U.S. and those born abroad to American parents.
The number of naturalized citizens who are eligible to vote more than doubled from 2000 to 2024 (the most recent year for which data is available). That is much larger than the increase in the total eligible voter population during that time period. In 2000, approximately 12 million people – about 6.2% of all eligible voters that year – were naturalized citizens.
In this analysis, we’ll answer some common questions about eligible voters who are naturalized citizens.
Who are eligible voters?
Eligible voters are people ages 18 and older who are U.S. citizens and live in the 50 states and the District of Columbia. In this analysis, naturalized citizen eligible voters (sometimes called immigrant eligible voters) are eligible voters who were born outside the U.S. and have gained U.S. citizenship through naturalization. U.S.-born eligible voters are those who were born in the U.S., in its territories or abroad to American parents.
Which states have the most eligible voters who are naturalized citizens?
About 1 in 5 eligible voters in California are naturalized citizens
% of each state’s eligible voters who are naturalized citizens, as of 2024

Note: Eligible voters are U.S. citizens ages 18 and older.
Source: Pew Research Center analysis of 2024 American Community Survey (IPUMS).
PEW RESEARCH CENTER
About 1 in 5 eligible voters in California are naturalized citizens
% of each state’s eligible voters who are naturalized citizens, as of 2024
| State | FIPS | % |
|---|---|---|
| California | 06 | 21.98 |
| New Jersey | 34 | 19.77 |
| New York | 36 | 18.87 |
| Florida | 12 | 17.23 |
| Hawaii | 15 | 15.55 |
| Nevada | 32 | 14.58 |
| Massachusetts | 25 | 13.14 |
| Maryland | 24 | 12.81 |
| Connecticut | 09 | 11.63 |
| Texas | 48 | 11.36 |
| Washington | 53 | 10.84 |
| Illinois | 17 | 10.83 |
| Rhode Island | 44 | 10.81 |
| Virginia | 51 | 9.98 |
| District of Columbia | 11 | 8.88 |
| Arizona | 04 | 8.56 |
| Georgia | 13 | 7.52 |
| Delaware | 10 | 7.22 |
| Minnesota | 27 | 6.69 |
| Oregon | 41 | 6.49 |
| Colorado | 08 | 6.46 |
| Pennsylvania | 42 | 5.98 |
| Alaska | 02 | 5.81 |
| Michigan | 26 | 5.74 |
| Utah | 49 | 5.52 |
| North Carolina | 37 | 5.49 |
| New Mexico | 35 | 5.36 |
| New Hampshire | 33 | 4.75 |
| Kansas | 20 | 4.56 |
| Nebraska | 31 | 4.52 |
| Oklahoma | 40 | 3.74 |
| South Carolina | 45 | 3.67 |
| Indiana | 18 | 3.67 |
| Ohio | 39 | 3.62 |
| Idaho | 16 | 3.54 |
| Tennessee | 47 | 3.35 |
| Wisconsin | 55 | 3.34 |
| Vermont | 50 | 3.31 |
| Missouri | 29 | 3.21 |
| Iowa | 19 | 3.09 |
| Maine | 23 | 2.95 |
| Louisiana | 22 | 2.72 |
| Arkansas | 05 | 2.56 |
| Kentucky | 21 | 2.25 |
| South Dakota | 46 | 2.13 |
| Alabama | 01 | 2.12 |
| North Dakota | 38 | 2.04 |
| Wyoming | 56 | 1.81 |
| Montana | 30 | 1.41 |
| Mississippi | 28 | 1.32 |
| West Virginia | 54 | 1.20 |
Note: Eligible voters are U.S. citizens ages 18 and older.
Source: Pew Research Center analysis of 2024 American Community Survey (IPUMS).
PEW RESEARCH CENTER
In 14 states, the share of eligible voters who are naturalized citizens roughly matches or exceeds the national percentage (10.3%). In six of those states, naturalized citizens make up around 15% or more of all eligible voters: California (22.0%), New Jersey (19.8%), New York (18.9%), Florida (17.2%), Hawaii (15.6%) and Nevada (14.6%).
The states where naturalized citizens account for the smallest shares of eligible voters include Montana (1.4%), Mississippi (1.3%) and West Virginia (1.2%).
How long have these eligible voters lived in the U.S.?
To apply for naturalization, a person must typically be a lawful permanent resident – also known as a green card holder – who has lived in the U.S. for at least five years, or three years if married to a U.S. citizen.
Around 92% of naturalized citizens who are eligible to vote have lived in the U.S. for 11 years or more, including 73% who have lived in the country for 21 years or more. Another 7.7% have lived in the U.S. for 10 years or less.
What are the most common origin countries for naturalized eligible voters?
About 15% of these eligible voters are from Mexico. Other commonly represented countries include the Philippines (6.4%), India (5.8%), China (4.8%) and Vietnam (4.4%).
This list is similar to the origins of U.S. immigrants generally, including those who are not eligible to vote.
In 2022, the same five countries topped the list. But the Philippines has since surpassed India and China to become the second-most common country of origin for eligible voters who are naturalized citizens. (Filipino immigrants have a high naturalization rate compared with immigrants overall.)
What’s the racial and ethnic makeup of naturalized eligible voters?
Around a third of naturalized citizens who are eligible to vote (33.2%) are Hispanic, while a similar share (32.3%) are Asian. Another 20.1% are White and 10.7% are Black.
Hispanic and Asian adults make up the largest shares of the naturalized eligible voter population
% of naturalized citizen eligible voters who are __, as of 2024

Note: Eligible voters are U.S. citizens ages 18 and older. White, Black and Asian eligible voters are those who report being only one race and are not Hispanic; Hispanics are of any race. Figures may not total 100% because eligible voters who gave other answers, including those who report being more than one race, are not shown.
Source: Pew Research Center analysis of 2024 American Community Survey (IPUMS).
PEW RESEARCH CENTER
Hispanic and Asian adults make up the largest shares of the naturalized eligible voter population
% of naturalized citizen eligible voters who are __, as of 2024
| Race | White | Black | Asian | Hispanic |
|---|---|---|---|---|
| Share of naturalized citizen eligible voters | 20.1 | 10.7 | 32.3 | 33.2 |
Note: Eligible voters are U.S. citizens ages 18 and older. White, Black and Asian eligible voters are those who report being only one race and are not Hispanic; Hispanics are of any race. Figures may not total 100% because eligible voters who gave other answers, including those who report being more than one race, are not shown.
Source: Pew Research Center analysis of 2024 American Community Survey (IPUMS).
PEW RESEARCH CENTER
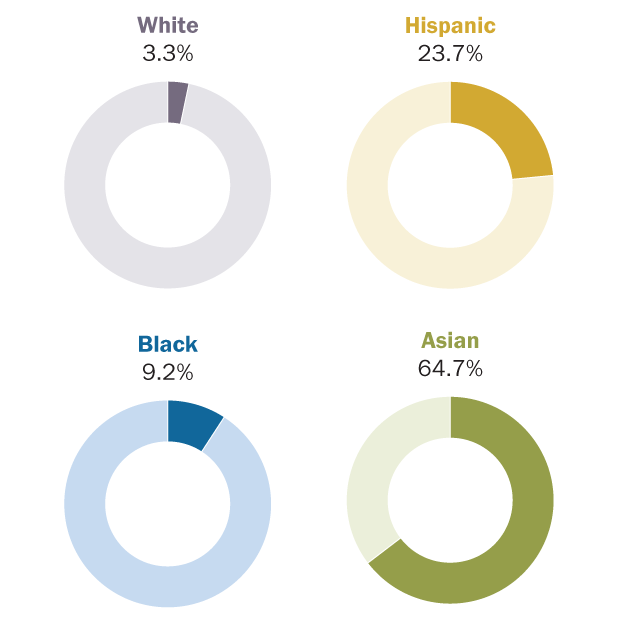
Asians are the only major racial or ethnic group whose eligible voter population is mostly immigrants. Nearly two-thirds of all Asian eligible voters (64.7%) are naturalized citizens. By comparison, 23.5% of Hispanic eligible voters are naturalized citizens, as are 9.2% of Black and 3.3% of White eligible voters.
Most Asian eligible voters are naturalized citizens
% of __ eligible voters who are naturalized citizens, as of 2024
Note: Eligible voters are U.S. citizens ages 18 and older. White, Black and Asian eligible voters are those who report being only one race and are not Hispanic; Hispanics are of any race.
Source: Pew Research Center analysis of 2024 American Community Survey (IPUMS).
PEW RESEARCH CENTER
Most Asian eligible voters are naturalized citizens
% of __ eligible voters who are naturalized citizens, as of 2024
| % | |
|---|---|
| White | 3.3 |
| Hispanic | 23.7 |
| Black | 9.2 |
| Asian | 64.7 |
Note: Eligible voters are U.S. citizens ages 18 and older. White, Black and Asian eligible voters are those who report being only one race and are not Hispanic; Hispanics are of any race.
Source: Pew Research Center analysis of 2024 American Community Survey (IPUMS).
PEW RESEARCH CENTER
Related: The U.S. Electorate’s Changing Racial and Ethnic Makeup
What languages do naturalized eligible voters speak?
To become a naturalized citizen, applicants must demonstrate English proficiency (unless they qualify for an exemption based on their age and length of time in the U.S.). So it’s not surprising that an overwhelming majority (96.4%) of naturalized citizens who are eligible to vote speak English. This is only slightly below the 99.9% of U.S.-born eligible voters who speak English.
But naturalized eligible voters have more linguistic diversity than their U.S.-born counterparts. Around three-quarters (76.0%) speak English and at least one other language, compared with 10.2% of U.S.-born eligible voters.
Among naturalized eligible voters, the top non-English languages spoken at home are Spanish (the most common by far), Chinese, Hindi and related languages, and Filipino/Tagalog. Among U.S.-born eligible voters who speak a language besides English, Spanish is also the most common.
How do naturalized citizens differ from U.S. born eligible voters when it comes to other demographic characteristics?
Age
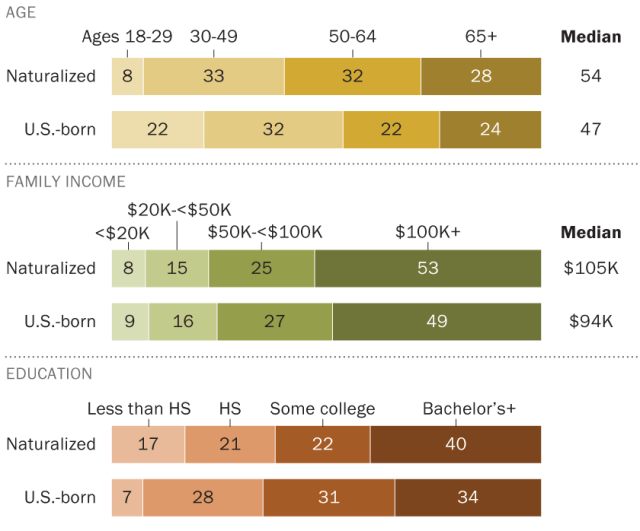
Eligible voters who are naturalized citizens tend to be older than their U.S.-born counterparts: 59.8% are ages 50 and older, compared with 46.1% of U.S.-born eligible voters. Conversely, just 7.5% of immigrant eligible voters are 18 to 29, compared with 21.5% of U.S.-born eligible voters.
How naturalized citizen eligible voters compare with U.S.-born eligible voters on demographic measures
% of eligible voters in each category, as of 2024
Note: Eligible voters are U.S. citizens ages 18 and older. U.S.-born eligible voters are those born in the U.S. or those born abroad to American parents. Medians are estimates.
Source: Pew Research Center analysis of 2024 American Community Survey (IPUMS).
PEW RESEARCH CENTER
How naturalized citizen eligible voters compare with U.S.-born eligible voters on demographic measures
% of eligible voters in each category, as of 2024
| Group | Share of naturalized eligible voters | Share of U.S.-born eligible voters | grouping |
|---|---|---|---|
| Ages 18-29 | 7.5 | 21.5 | age |
| 30-49 | 32.8 | 32.3 | age |
| 50-64 | 31.8 | 22.4 | age |
| 65+ | 28.0 | 23.7 | age |
| <$20K | 7.9 | 8.7 | income |
| $20K-<$50K | 14.7 | 15.9 | income |
| $50K-<$100K | 24.6 | 26.8 | income |
| $100K+ | 52.8 | 48.6 | income |
| Less than HS | 17.1 | 7.3 | school |
| HS | 21.0 | 28.0 | school |
| Some college | 22.1 | 30.6 | school |
| Bachelor’s+ | 39.8 | 34.1 | school |
Note: Eligible voters are U.S. citizens ages 18 and older. U.S.-born eligible voters are those born in the U.S. or those born abroad to American parents. Medians are estimates.
Source: Pew Research Center analysis of 2024 American Community Survey (IPUMS).
PEW RESEARCH CENTER
The median age for immigrant eligible voters is 54, versus 47 for U.S.-born eligible voters.
Income
The median family income among naturalized eligible voters is $105,000, compared with $94,000 among U.S.-born eligible voters.
Education
Naturalized eligible voters tend to have higher educational attainment than U.S.-born eligible voters. Nearly four-in-ten (39.8%) have a bachelor’s degree or more, compared with 34.1% of U.S.-born eligible voters.