
The American Trends Panel survey methodology
Overview
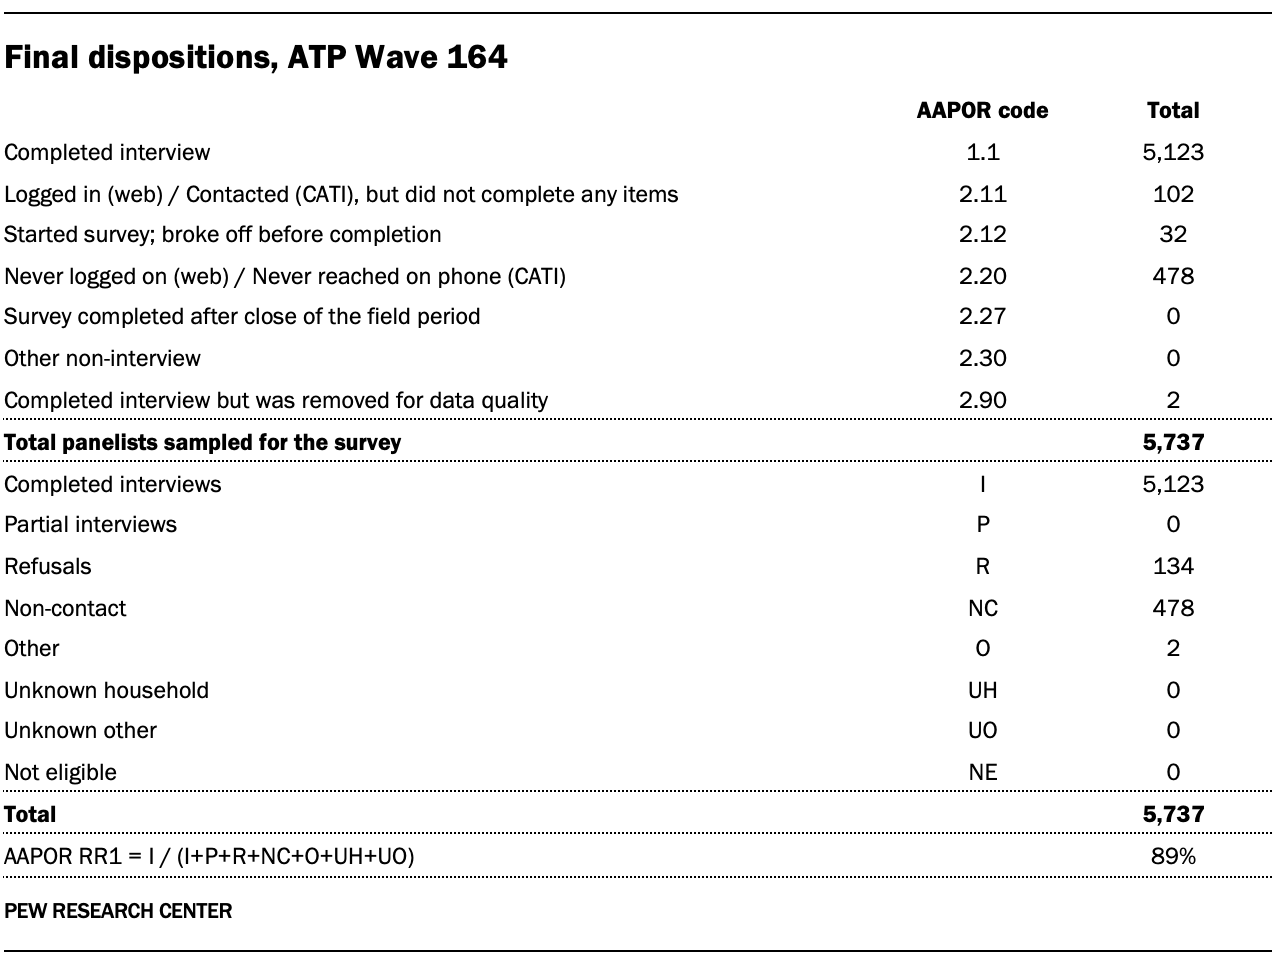
Data in this report comes from Wave 164 of the American Trends Panel (ATP), Pew Research Center’s nationally representative panel of randomly selected U.S. adults. The survey was conducted from Feb. 24 to March 2, 2025. A total of 5,123 panelists responded out of 5,737 who were sampled, for a survey-level response rate of 89%.
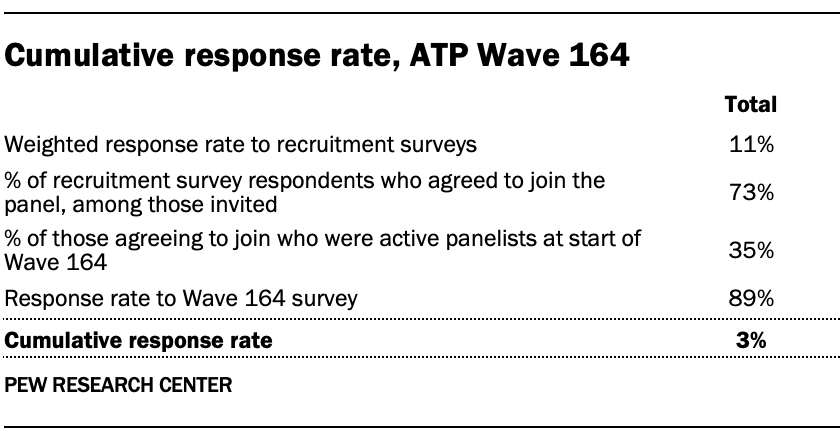
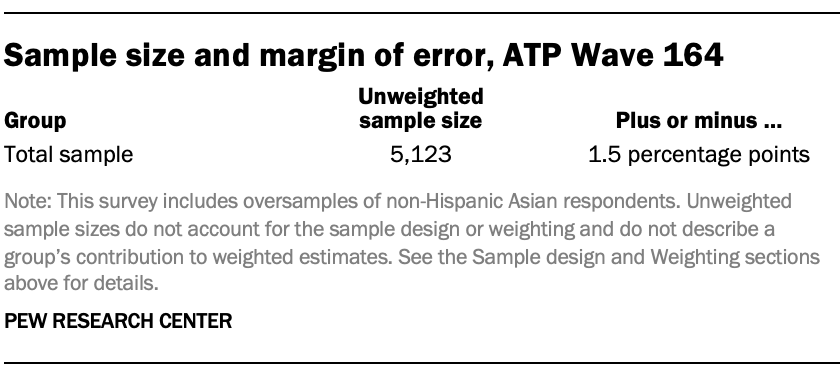
The cumulative response rate accounting for nonresponse to the recruitment surveys and attrition is 3%. The break-off rate among panelists who logged on to the survey and completed at least one item is 1%. The margin of sampling error for the full sample of 5,123 respondents is plus or minus 1.5 percentage points.
The survey includes an oversample of non-Hispanic Asian adults in order to provide more precise estimates of the opinions and experiences of these smaller demographic subgroups. These oversampled groups are weighted back to reflect their correct proportions in the population.
SSRS conducted the survey for Pew Research Center via online (n=4,939) and live telephone (n=184) interviewing. Interviews were conducted in both English and Spanish.
To learn more about the ATP, read “About the American Trends Panel.”
Panel recruitment
Since 2018, the ATP has used address-based sampling (ABS) for recruitment. A study cover letter and a pre-incentive are mailed to a stratified, random sample of households selected from the U.S. Postal Service’s Computerized Delivery Sequence File. This Postal Service file has been estimated to cover 90% to 98% of the population. Within each sampled household, the adult with the next birthday is selected to participate. Other details of the ABS recruitment protocol have changed over time but are available upon request. Prior to 2018, the ATP was recruited using landline and cellphone random-digit-dial surveys administered in English and Spanish. A national sample of U.S. adults has been recruited to the ATP approximately once per year since 2014. In some years, the recruitment has included additional efforts (known as an “oversample”) to improve the accuracy of data for underrepresented groups. For example, Hispanic adults, Black adults and Asian adults were oversampled in 2019, 2022 and 2023, respectively.
Sample design
The overall target population for this survey was noninstitutionalized persons ages 18 and older living in the United States. It featured a stratified random sample from the ATP in which non-Hispanic Asian adults were selected with certainty. The remaining panelists were sampled at rates designed to ensure that the share of respondents in each stratum is proportional to its share of the U.S. adult population to the greatest extent possible. Respondent weights are adjusted to account for differential probabilities of selection as described in the Weighting section below.
Questionnaire development and testing
The questionnaire was developed by Pew Research Center in consultation with SSRS. The web program used for online respondents was rigorously tested on both PC and mobile devices by the SSRS project team and Pew Research Center researchers. The SSRS project team also populated test data that was analyzed in SPSS to ensure the logic and randomizations were working as intended before launching the survey.
Incentives
All respondents were offered a post-paid incentive for their participation. Respondents could choose to receive the post-paid incentive in the form of a check or gift code to Amazon.com, Target.com or Walmart.com. Incentive amounts ranged from $5 to $20 depending on whether the respondent belongs to a part of the population that is harder or easier to reach. Differential incentive amounts were designed to increase panel survey participation among groups that traditionally have low survey response propensities.
Data collection protocol
The data collection field period for this survey was Feb. 24 to March 2, 2025. Surveys were conducted via self-administered web survey or by live telephone interviewing.
For panelists who take surveys online: Postcard notifications were mailed to a subset on Feb. 24. Survey invitations were sent out in two separate launches: soft launch and full launch. Sixty panelists were included in the soft launch, which began with an initial invitation sent on Feb. 24. All remaining English- and Spanish-speaking sampled online panelists were included in the full launch and were sent an invitation on Feb 25.
Data quality checks
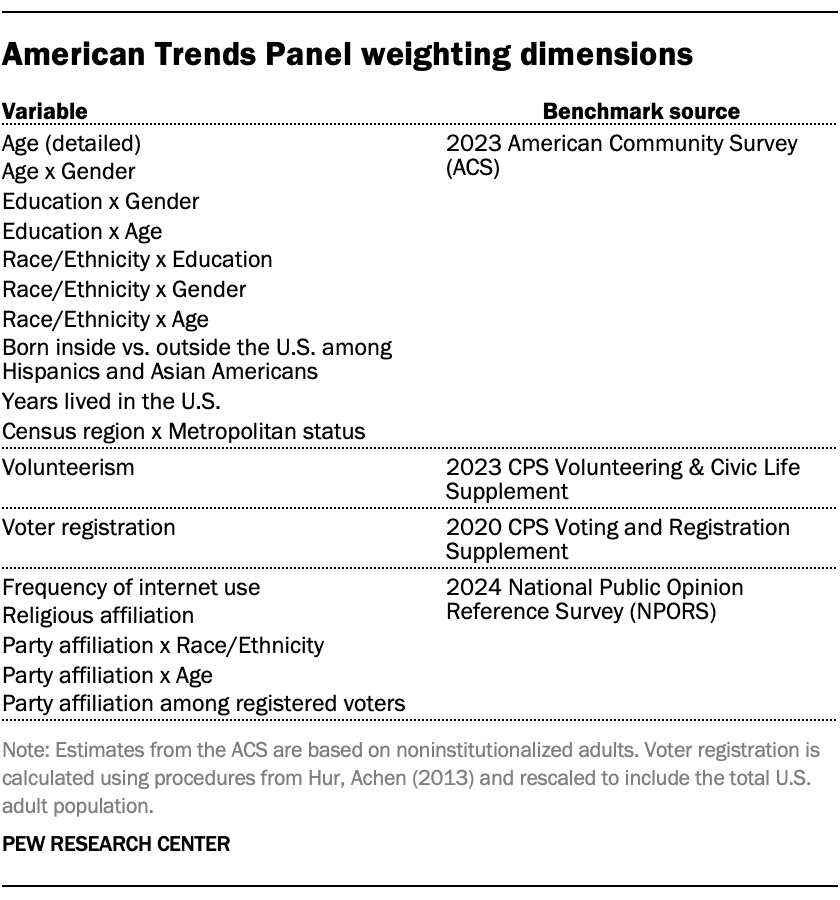
Weighting
Dispositions and response rates