
In all 36 countries surveyed by Pew Research Center this year, views of the United States are more positive among people who have confidence in President Donald Trump to do the right thing regarding world affairs – and more negative among those who lack confidence in him. But this close relationship between views of the U.S. and its president hasn’t always been the case.
During Joe Biden’s presidency, as well as during Trump’s first term, there was a much weaker relationship between views of the U.S. and confidence in its president.
In Trump’s second term, international views of U.S. are increasingly linked with views of its president
Correlation between favorability of the U.S. and confidence in the U.S. president to do the right thing regarding world affairs, across 23 countries
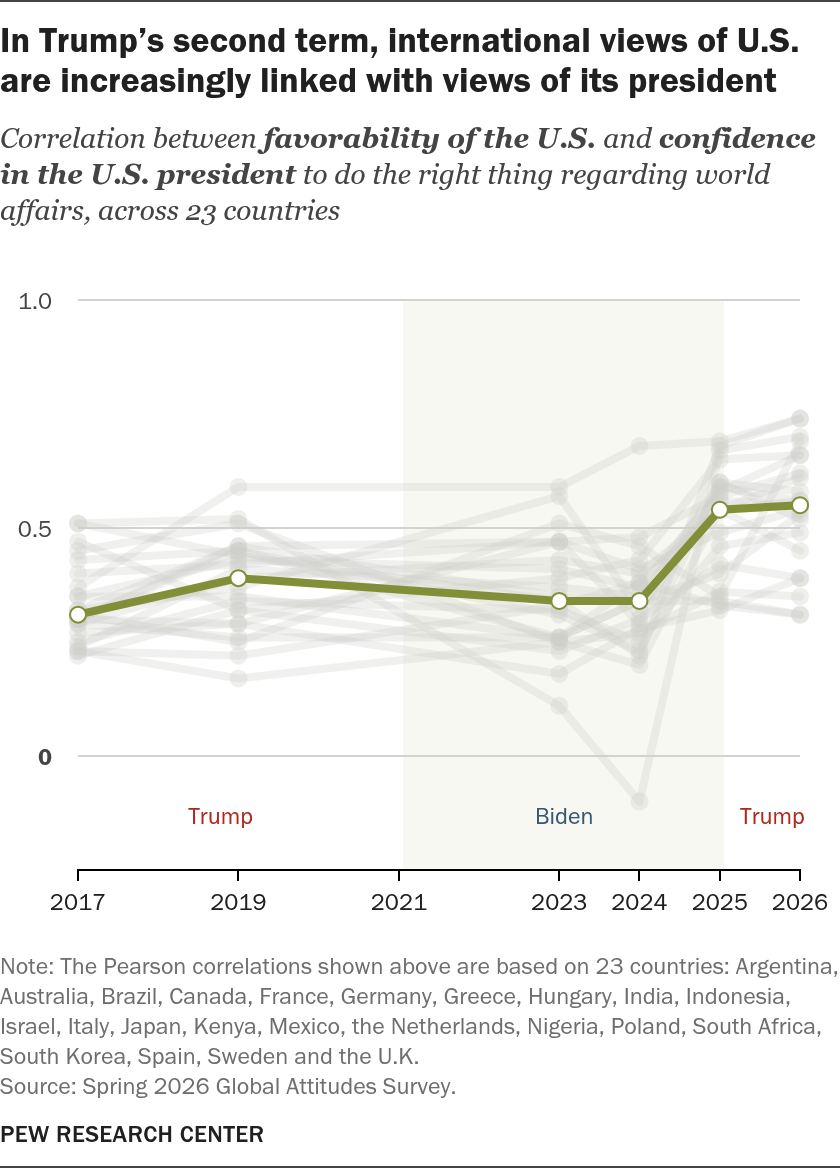
Note: The Pearson correlations shown above are based on 23 countries: Argentina, Australia, Brazil, Canada, France, Germany, Greece, Hungary, India, Indonesia, Israel, Italy, Japan, Kenya, Mexico, the Netherlands, Nigeria, Poland, South Africa, South Korea, Spain, Sweden and the U.K.
Source: Spring 2026 Global Attitudes Survey.
PEW RESEARCH CENTER
In Trump’s second term, international views of U.S. are increasingly linked with views of its president
Correlation between favorability of the U.S. and confidence in the U.S. president to do the right thing regarding world affairs, across 23 countries
| Country | Median | Argentina | Australia | Brazil | Canada | France | Germany | Greece | Hungary | India | Indonesia | Israel | Italy | Japan | Kenya | Mexico | Netherlands | Nigeria | Poland | South Africa | South Korea | Spain | Sweden | U.K. |
|---|---|---|---|---|---|---|---|---|---|---|---|---|---|---|---|---|---|---|---|---|---|---|---|---|
| 2017 | 0.31 | 0.30 | 0.51 | 0.25 | 0.51 | 0.40 | 0.29 | 0.32 | 0.30 | 0.27 | 0.47 | 0.37 | 0.30 | 0.35 | 0.23 | 0.29 | 0.43 | 0.31 | 0.22 | 0.23 | 0.24 | 0.35 | 0.32 | 0.45 |
| 2019 | 0.39 | 0.45 | 0.44 | 0.34 | 0.52 | 0.42 | 0.39 | 0.37 | 0.29 | 0.29 | 0.32 | 0.59 | 0.46 | 0.35 | 0.17 | 0.26 | 0.45 | 0.25 | 0.32 | 0.22 | 0.41 | 0.43 | 0.46 | 0.51 |
| 2023 | 0.34 | 0.26 | 0.34 | 0.32 | 0.11 | 0.47 | 0.43 | 0.57 | 0.47 | 0.18 | 0.23 | 0.59 | 0.47 | 0.26 | 0.25 | 0.26 | 0.31 | 0.51 | 0.39 | 0.33 | 0.37 | 0.41 | 0.35 | 0.25 |
| 2024 | 0.34 | 0.38 | 0.22 | 0.25 | -0.10 | 0.29 | 0.40 | 0.32 | 0.48 | 0.28 | 0.30 | 0.68 | 0.41 | 0.34 | 0.27 | 0.34 | 0.23 | 0.46 | 0.43 | 0.38 | 0.35 | 0.37 | 0.34 | 0.20 |
| 2025 | 0.54 | 0.54 | 0.68 | 0.46 | 0.67 | 0.59 | 0.54 | 0.56 | 0.57 | 0.32 | 0.42 | 0.69 | 0.49 | 0.40 | 0.36 | 0.34 | 0.60 | 0.35 | 0.65 | 0.33 | 0.54 | 0.58 | 0.60 | 0.54 |
| 2026 | 0.55 | 0.56 | 0.74 | 0.49 | 0.70 | 0.56 | 0.45 | 0.55 | 0.62 | 0.39 | 0.39 | 0.74 | 0.54 | 0.53 | 0.35 | 0.31 | 0.52 | 0.69 | 0.66 | 0.31 | 0.61 | 0.66 | 0.58 | 0.55 |
Note: The Pearson correlations shown above are based on 23 countries: Argentina, Australia, Brazil, Canada, France, Germany, Greece, Hungary, India, Indonesia, Israel, Italy, Japan, Kenya, Mexico, the Netherlands, Nigeria, Poland, South Africa, South Korea, Spain, Sweden and the U.K.
Source: Spring 2026 Global Attitudes Survey.
PEW RESEARCH CENTER
Take South Korea, for example. In 2023 and 2024, during the final years of the Biden administration, many South Koreans who expressed a positive view of the U.S. did not necessarily have confidence in Biden. The correlation was r=0.37 in 2023 and r=0.35 in 2024. (Read more about correlation coefficients here.)
The same was true during Trump’s first term. Most South Koreans lacked confidence in Trump to do the right thing regarding world affairs in 2017, with 16% expressing confidence and 78% no confidence. But even among those with no confidence in Trump, 71% still had a favorable view of the U.S.
Following Trump’s return to the White House, however, these correlations increased to 0.54 in 2025 and 0.61 in 2026. (A correlation of 1.0 means that as one variable increases, the other does as well, in a predictable, straight-line pattern.)
During Trump’s second term, in other words, South Koreans have become much more likely to view both the U.S. and its president the same way. Now, 68% of South Koreans who lack confidence in Trump have a negative view of the U.S.
Related: How South Koreans view their relationship with the U.S.
The dynamic in South Korea is not unique. People in many countries now evaluate the U.S. and its president as a “package,” rather than separately.
Poland is another country that shows this pattern clearly. In 2017, during Trump’s first term, the correlation between views of the U.S. and confidence in Trump was 0.22. Now, it has tripled to 0.66. Put differently, 70% of adults in Poland who lacked confidence in Trump still had a positive view of the U.S. in 2017. This year, the U.S. is viewed positively by 31% of Poles who lack confidence in Trump.
Views of U.S. and its president were also highly correlated during George W. Bush’s presidency
Pew Research Center has measured attitudes toward the U.S. and its president for more than two decades in some countries. Findings from France, Germany, Spain and the United Kingdom allow us to take a longer view when evaluating the relationship between these two variables.
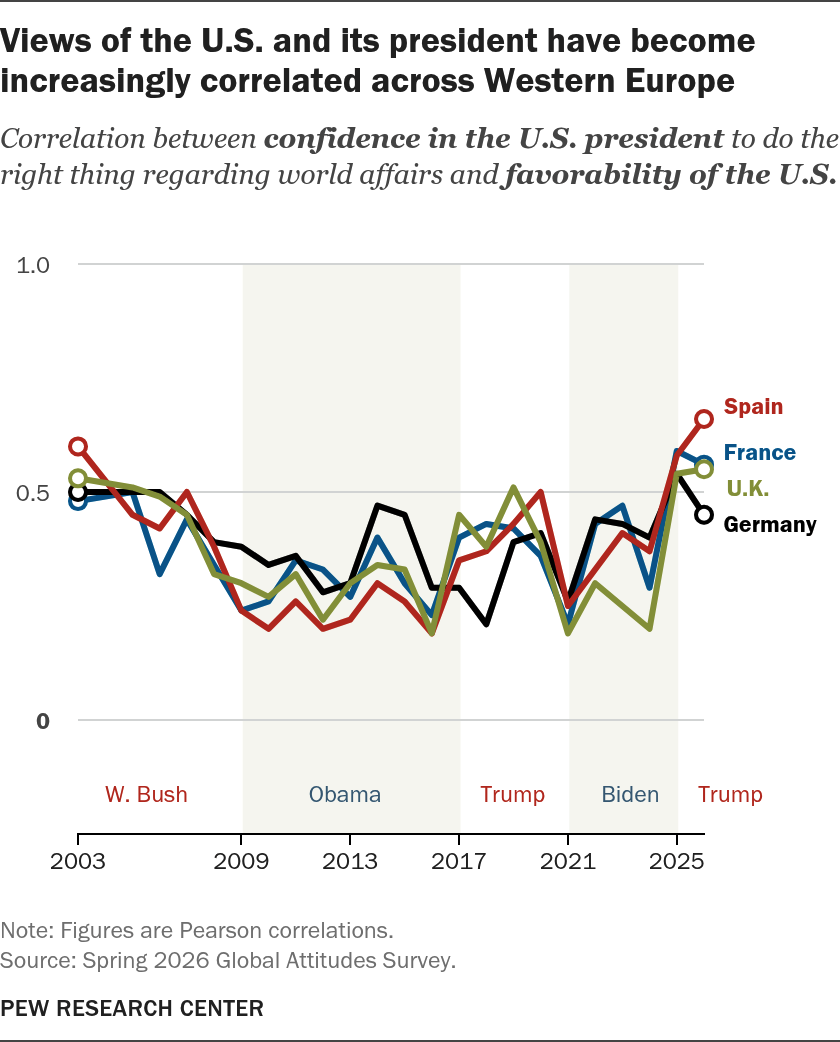
From 2003 to 2005, during the administration of George W. Bush (and in the early stages of the Iraq war), views of the U.S. were also moderately correlated with confidence in the U.S. president in these four countries. But between 2006 and 2024, the two variables were generally not as closely linked. Now, in Trump’s second term, these correlations are at or near record highs in these countries.
Views of the U.S. and its president have become increasingly correlated across Western Europe
Correlation between confidence in the U.S. president to do the right thing regarding world affairs and favorability of the U.S.
Note: Figures are Pearson correlations.
Source: Spring 2026 Global Attitudes Survey.
PEW RESEARCH CENTER
Views of the U.S. and its president have become increasingly correlated across Western Europe
Correlation between confidence in the U.S. president to do the right thing regarding world affairs and favorability of the U.S.
| Year | France | Germany | Spain | U.K. |
|---|---|---|---|---|
| 2003 | 0.48 | 0.50 | 0.60 | 0.53 |
| 2005 | 0.50 | 0.50 | 0.45 | 0.51 |
| 2006 | 0.32 | 0.50 | 0.42 | 0.49 |
| 2007 | 0.44 | 0.45 | 0.50 | 0.45 |
| 2008 | 0.34 | 0.39 | 0.38 | 0.32 |
| 2009 | 0.24 | 0.38 | 0.24 | 0.30 |
| 2010 | 0.26 | 0.34 | 0.20 | 0.27 |
| 2011 | 0.35 | 0.36 | 0.26 | 0.32 |
| 2012 | 0.33 | 0.28 | 0.20 | 0.22 |
| 2013 | 0.27 | 0.30 | 0.22 | 0.30 |
| 2014 | 0.40 | 0.47 | 0.30 | 0.34 |
| 2015 | 0.30 | 0.45 | 0.26 | 0.33 |
| 2016 | 0.23 | 0.29 | 0.19 | 0.19 |
| 2017 | 0.40 | 0.29 | 0.35 | 0.45 |
| 2018 | 0.43 | 0.21 | 0.37 | 0.38 |
| 2019 | 0.42 | 0.39 | 0.43 | 0.51 |
| 2020 | 0.36 | 0.41 | 0.50 | 0.39 |
| 2021 | 0.21 | 0.26 | 0.25 | 0.19 |
| 2022 | 0.43 | 0.44 | 0.33 | 0.30 |
| 2023 | 0.47 | 0.43 | 0.41 | 0.25 |
| 2024 | 0.29 | 0.40 | 0.37 | 0.20 |
| 2025 | 0.59 | 0.54 | 0.58 | 0.54 |
| 2026 | 0.56 | 0.45 | 0.66 | 0.55 |
Note: Figures are Pearson correlations.
Source: Spring 2026 Global Attitudes Survey.
PEW RESEARCH CENTER
International views of China, Russia are also linked to views of their leaders
The U.S. is not the only place where views of the country have become more strongly associated with views of its leader.
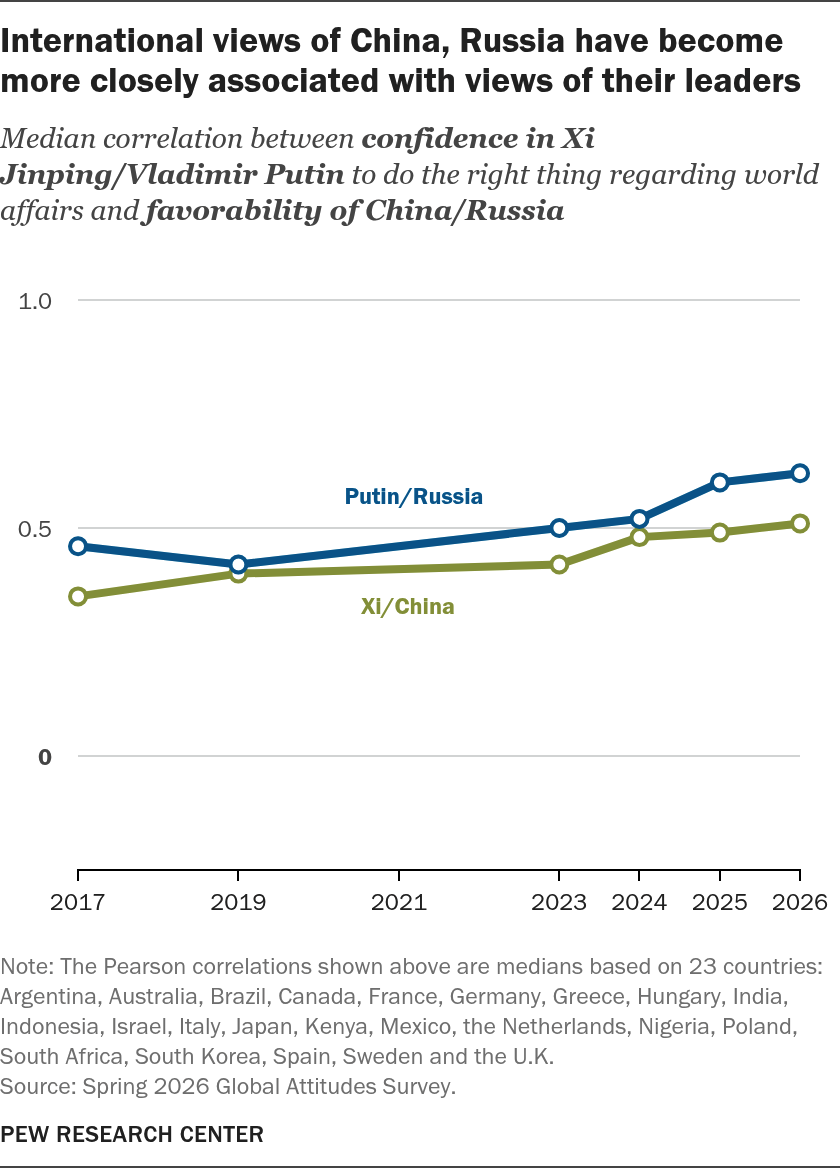
Views of China and Russia have followed a similar pattern. Views of the two countries have become increasingly correlated with confidence in their longtime leaders, Xi Jinping and Vladimir Putin, across 23 nations surveyed by Pew Research Center.
International views of China, Russia have become more closely associated with views of their leaders
Median correlation between confidence in Xi Jinping/Vladimir Putin to do the right thing regarding world affairs and favorability of China/Russia
Note: The Pearson correlations shown above are medians based on 23 countries: Argentina, Australia, Brazil, Canada, France, Germany, Greece, Hungary, India, Indonesia, Israel, Italy, Japan, Kenya, Mexico, the Netherlands, Nigeria, Poland, South Africa, South Korea, Spain, Sweden and the U.K.
Source: Spring 2026 Global Attitudes Survey.
PEW RESEARCH CENTER
International views of China, Russia have become more closely associated with views of their leaders
Median correlation between confidence in Xi Jinping/Vladimir Putin to do the right thing regarding world affairs and favorability of China/Russia
| Year | Xi/China | Putin/Russia |
|---|---|---|
| 2017 | 0.35 | 0.46 |
| 2019 | 0.40 | 0.42 |
| 2023 | 0.42 | 0.50 |
| 2024 | 0.48 | 0.52 |
| 2025 | 0.49 | 0.60 |
| 2026 | 0.51 | 0.62 |
Note: The Pearson correlations shown above are medians based on 23 countries: Argentina, Australia, Brazil, Canada, France, Germany, Greece, Hungary, India, Indonesia, Israel, Italy, Japan, Kenya, Mexico, the Netherlands, Nigeria, Poland, South Africa, South Korea, Spain, Sweden and the U.K.
Source: Spring 2026 Global Attitudes Survey.
PEW RESEARCH CENTER
Country-level correlations follow the same pattern as individual-level correlations
It’s also possible to examine country-level correlations between views of the U.S. and its president, rather than individual-level correlations. Country-level correlations can help cancel out some of the random “noise” present in any survey.
In this case, the country-level correlations reveal a clear pattern: You can predict a country’s favorability toward the U.S. if you also know the percentage of its people who are confident in Trump. And as is true with individual-level correlations, this has not always been the case.
During the Biden administration in 2024, views of the U.S. and confidence in its president diverged considerably. In Brazil, for example, people were much more favorable toward the U.S. (64% favorable) than they were toward Biden (37% confident). There were similar differences of 20 percentage points or more on these two questions in Italy, Mexico and South Korea.
But in each of the last two years, favorability of the U.S. has been much more strongly correlated with confidence in the president. The correlation across 23 surveyed countries was 0.91 in 2025 and 0.90 this year.
To be clear, there are some countries where views of the U.S. and its president differ significantly. In Mexico, for instance, 40% have a positive view of the U.S. while far fewer (11%) have confidence in Trump.
Elsewhere, however, there is a strong assocation – both in the positive and negative direction. In Kenya, 63% view the U.S. favorably and an identical 63% have confidence in Trump. In Sweden, by contrast, 19% view the U.S. favorably and 11% have confidence in Trump.
Across 20 countries, views of the U.S. and confidence in the U.S. president have become more strongly correlated
% who have a favorable view of the U.S. (left axis) and % who have confidence in the U.S. president to do the right thing regarding world affairs (bottom axis)
2017

2019
2023
2024
2025
2026
Source: Spring 2026 Global Attitudes Survey.
PEW RESEARCH CENTER
Across 20 countries, views of the U.S. and confidence in the U.S. president have become more strongly correlated
% who have a favorable view of the U.S. (left axis) and % who have confidence in the U.S. president to do the right thing regarding world affairs (bottom axis)
| Country | Year | % Confident in U.S. president | % Favorable toward U.S. |
|---|---|---|---|
| Argentina | 2026 | 29 | 44 |
| Australia | 2026 | 18 | 24 |
| Brazil | 2026 | 30 | 47 |
| Canada | 2026 | 20 | 33 |
| France | 2026 | 15 | 27 |
| Germany | 2026 | 16 | 27 |
| Greece | 2026 | 22 | 37 |
| Indonesia | 2026 | 20 | 29 |
| Israel | 2026 | 66 | 81 |
| Italy | 2026 | 17 | 31 |
| Japan | 2026 | 25 | 50 |
| Kenya | 2026 | 63 | 63 |
| Mexico | 2026 | 11 | 40 |
| Netherlands | 2026 | 15 | 25 |
| Nigeria | 2026 | 65 | 63 |
| South Africa | 2026 | 26 | 35 |
| South Korea | 2026 | 22 | 45 |
| Spain | 2026 | 21 | 30 |
| Sweden | 2026 | 11 | 19 |
| U.K. | 2026 | 26 | 41 |
| Argentina | 2025 | 32 | 52 |
| Australia | 2025 | 22 | 29 |
| Brazil | 2025 | 34 | 56 |
| Canada | 2025 | 22 | 34 |
| France | 2025 | 22 | 36 |
| Germany | 2025 | 18 | 33 |
| Greece | 2025 | 37 | 45 |
| Indonesia | 2025 | 34 | 48 |
| Israel | 2025 | 69 | 83 |
| Italy | 2025 | 32 | 47 |
| Japan | 2025 | 38 | 55 |
| Kenya | 2025 | 64 | 62 |
| Mexico | 2025 | 8 | 29 |
| Netherlands | 2025 | 22 | 29 |
| Nigeria | 2025 | 79 | 78 |
| South Africa | 2025 | 41 | 50 |
| South Korea | 2025 | 33 | 61 |
| Spain | 2025 | 19 | 31 |
| Sweden | 2025 | 15 | 19 |
| U.K. | 2025 | 37 | 50 |
| Argentina | 2024 | 36 | 53 |
| Australia | 2024 | 40 | 40 |
| Brazil | 2024 | 37 | 64 |
| Canada | 2024 | 52 | 54 |
| France | 2024 | 42 | 46 |
| Germany | 2024 | 63 | 49 |
| Greece | 2024 | 34 | 48 |
| Indonesia | 2024 | 52 | 57 |
| Israel | 2024 | 57 | 77 |
| Italy | 2024 | 33 | 56 |
| Japan | 2024 | 54 | 70 |
| Kenya | 2024 | 75 | 78 |
| Mexico | 2024 | 36 | 61 |
| Netherlands | 2024 | 62 | 48 |
| Nigeria | 2024 | 66 | 72 |
| South Africa | 2024 | 36 | 49 |
| South Korea | 2024 | 53 | 77 |
| Spain | 2024 | 35 | 48 |
| Sweden | 2024 | 63 | 47 |
| U.K. | 2024 | 40 | 54 |
| Argentina | 2023 | 29 | 52 |
| Australia | 2023 | 54 | 52 |
| Brazil | 2023 | 43 | 63 |
| Canada | 2023 | 58 | 57 |
| France | 2023 | 47 | 52 |
| Germany | 2023 | 67 | 57 |
| Greece | 2023 | 43 | 56 |
| Indonesia | 2023 | 40 | 55 |
| Israel | 2023 | 68 | 87 |
| Italy | 2023 | 42 | 60 |
| Japan | 2023 | 65 | 73 |
| Kenya | 2023 | 76 | 71 |
| Mexico | 2023 | 43 | 63 |
| Netherlands | 2023 | 68 | 58 |
| Nigeria | 2023 | 71 | 74 |
| South Africa | 2023 | 53 | 59 |
| South Korea | 2023 | 60 | 79 |
| Spain | 2023 | 48 | 55 |
| Sweden | 2023 | 76 | 55 |
| U.K. | 2023 | 54 | 59 |
| Argentina | 2019 | 23 | 41 |
| Australia | 2019 | 35 | 49 |
| Brazil | 2019 | 28 | 56 |
| Canada | 2019 | 28 | 51 |
| France | 2019 | 21 | 48 |
| Germany | 2019 | 13 | 39 |
| Greece | 2019 | 25 | 54 |
| Indonesia | 2019 | 30 | 42 |
| Israel | 2019 | 70 | 84 |
| Italy | 2019 | 33 | 61 |
| Japan | 2019 | 35 | 68 |
| Kenya | 2019 | 64 | 61 |
| Mexico | 2019 | 8 | 35 |
| Netherlands | 2019 | 24 | 46 |
| Nigeria | 2019 | 58 | 62 |
| South Africa | 2019 | 41 | 50 |
| South Korea | 2019 | 46 | 77 |
| Spain | 2019 | 21 | 52 |
| Sweden | 2019 | 18 | 46 |
| U.K. | 2019 | 32 | 57 |
| Argentina | 2017 | 14 | 35 |
| Australia | 2017 | 29 | 48 |
| Brazil | 2017 | 14 | 50 |
| Canada | 2017 | 22 | 43 |
| France | 2017 | 13 | 46 |
| Germany | 2017 | 11 | 35 |
| Greece | 2017 | 19 | 44 |
| Indonesia | 2017 | 23 | 48 |
| Israel | 2017 | 56 | 81 |
| Italy | 2017 | 25 | 61 |
| Japan | 2017 | 24 | 57 |
| Kenya | 2017 | 51 | 54 |
| Mexico | 2017 | 5 | 29 |
| Netherlands | 2017 | 17 | 37 |
| Nigeria | 2017 | 58 | 70 |
| South Africa | 2017 | 39 | 53 |
| South Korea | 2017 | 16 | 74 |
| Spain | 2017 | 7 | 31 |
| Sweden | 2017 | 10 | 45 |
| U.K. | 2017 | 22 | 50 |
Source: Spring 2026 Global Attitudes Survey.
PEW RESEARCH CENTER