
People of Middle Eastern or North African origin are a growing segment of the U.S. population. There are several ways we can estimate the size of this population today, using self-reported ancestry, race and other factors. Depending on which of these characteristics we consider, our estimates range from 3.1 to 5.2 million people, according to a Pew Research Center analysis of 2024 data.
When government surveys ask about race, there is no “Middle Eastern or North African” (MENA) category that people can select. Instead, the U.S. Census Bureau classifies people who give a MENA origin – like Lebanese, Iranian or Egyptian – as White, even though that may not reflect their identity or lived experience.
In 2024, the government updated its standards for race and ethnicity data. Among other changes, it added a MENA race category in all federal statistics, to be implemented by March 2029. The Census Bureau said the update would produce more accurate race and ethnicity data, which can affect things like the drawing of congressional districts and distribution of government resources. MENA community groups had long advocated for this change to give them higher visibility.
U.S. MENA population is growing, no matter how you measure it
Estimated U.S. Middle Eastern or North African (MENA) population, based on …

Note: “Other factors” include birthplace, language and family relationship. Race was used as part of that estimate in 2024 only. Refer to the methodology for more details.
Source: Pew Research Center analysis of the 1980, 1990 and 2000 decennial censuses (5%) and the 2006, 2010, 2015, 2019, 2021 and 2024 American Community Surveys (IPUMS).
PEW RESEARCH CENTER
U.S. MENA population is growing, no matter how you measure it
Estimated U.S. Middle Eastern or North African (MENA) population, based on …
| Year | Ancestry and other factors | Ancestry only |
|---|---|---|
| 2024 | 5,197,000 | 3,095,000 |
| 2021 | 4,617,000 | 2,927,000 |
| 2019 | 4,214,000 | 2,739,000 |
| 2015 | 3,960,000 | 2,664,000 |
| 2010 | 3,322,000 | 2,320,000 |
| 2006 | 3,029,000 | 2,098,000 |
| 2000 | 2,590,000 | 1,692,000 |
| 1990 | 1,811,000 | 1,217,000 |
| 1980 | 1,231,000 | 810,000 |
Note: “Other factors” include birthplace, language and family relationship. Race was used as part of that estimate in 2024 only. Refer to the methodology for more details.
Source: Pew Research Center analysis of the 1980, 1990 and 2000 decennial censuses (5%) and the 2006, 2010, 2015, 2019, 2021 and 2024 American Community Surveys (IPUMS).
PEW RESEARCH CENTER
But exactly when – and whether – these changes will take place is unknown. The Trump administration has twice delayed rolling out these revisions, and it recently proposed removing all questions about race and ethnicity from the 2030 census.
In this analysis, we explain the government’s approach to counting the U.S. MENA population and the ways we can estimate the size of the population with available public data.
Related: How the Census Measures Identity and What Americans Think About It
How does the U.S. Census Bureau define MENA?
Since 1977, federal standards for race and ethnicity data have defined the White population as people “having origins in any of the original peoples of Europe, the Middle East or North Africa.” This language can be traced to U.S. immigration law and lawsuits from the early 1900s. In 1997, the government rejected proposals for a separate MENA race category, though research on the topic continued.
2015 National Content Test
In 2015, the Census Bureau conducted the National Content Test (NCT) to improve race and ethnicity questions ahead of the 2020 census. It established a working definition for MENA that included Arab and non-Arab groups, nationalities and ethnicities from the region, and pan-ethnic and more general geographic terms.
It also tested who identified as MENA when given the option using two versions of the questionnaire: one that included the MENA category in the race question and one that did not. Among respondents who received the first questionnaire and were included in the bureau’s working definition of MENA, 76% identified their race as Middle Eastern or North African.
30 groups were in the Census Bureau’s 2015 working MENA definition
| Algerian | Amazigh or Berber | “Arab” | Assyrian | Bahraini |
| Bedouin | Chaldean | Copt | Druze | Egyptian |
| Emirati | Iranian | Iraqi | Israeli | Jordanian |
| Kurdish | Kuwaiti | Lebanese | Libyan | “Middle Eastern” |
| Moroccan | “North African” | Omani | Palestinian | Qatari |
| Saudi Arabian | Syriac | Syrian | Tunisian | Yemeni |
Source: U.S. Census Bureau, 2015 National Content Test.
PEW RESEARCH CENTER
The Census Bureau used the results of the NCT to refine the definition and geographical boundaries of MENA. For example, Turkey, Armenia and Sudan are not part of MENA based on the bureau’s analysis of NCT responses, though many analysts and interest groups still treat them as MENA.
2020 census
2020 census included Middle Eastern and North African origins as ‘White’
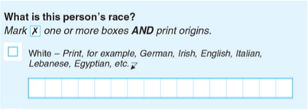
Source: U.S. Census Bureau, excerpt of 2020 decennial census questionnaire.
PEW RESEARCH CENTER
Despite the results of the NCT, the Census Bureau did not update the race and ethnicity categories on the 2020 census. But it did make other changes to the race question, including:
- Adding space for people to write in their origin under the White category
- Offering “Lebanese” and “Egyptian” as origin examples to prompt more specific MENA responses
Lebanese, Iranians and Egyptians are the largest MENA groups in the U.S.
Populations of U.S. Middle Eastern or North African (MENA) origin groups, 2024

Note: Groups are alone or in combination with other responses to the race question; individuals may be counted more than once.
Source: 2024 American Community Survey (census tables).
PEW RESEARCH CENTER
Lebanese, Iranians and Egyptians are the largest MENA groups in the U.S.
Populations of U.S. Middle Eastern or North African (MENA) origin groups, 2024
| MENA group | Alone or in combination |
|---|---|
| Lebanese | 825,000 |
| Iranian | 583,000 |
| Egyptian | 441,000 |
| Syrian | 264,000 |
| Arab | 253,000 |
| Iraqi | 216,000 |
| Palestinian | 212,000 |
| Israeli | 198,000 |
| Moroccan | 177,000 |
| Jordanian | 122,000 |
| Yemeni | 105,000 |
Note: Groups are alone or in combination with other responses to the race question; individuals may be counted more than once.
Source: 2024 American Community Survey (census tables).
PEW RESEARCH CENTER
By asking the question this way, the bureau counted about 3.5 million Americans of Middle Eastern or North African origin and nearly 30 detailed MENA groups in 2020. This is the only time it has published the total for all MENA write-in responses to the race question as well as for detailed groups.
Still, this estimate is likely too low because it only includes people who volunteered a MENA origin in the write-in section. If someone of MENA background didn’t specify their origin, they weren’t counted in the MENA population.
Using the same method as the 2020 census, the Census Bureau published population estimates for some MENA groups in 2024. The largest groups are:
- Lebanese: 825,000 people
- Iranian: 583,000
- Egyptian: 441,000
This was the first time since the 2020 census that the bureau published data on MENA as subgroups of the White population. However, it didn’t release an estimate for the total number of people identifying as MENA in 2024.
How did we estimate the size of the MENA population?
Beyond the Census Bureau’s race category, there are several other ways to estimate the size of the MENA population. The bureau’s definition of MENA groups can be matched to data on ancestry, birthplace, language, race and family relationships. These characteristics can indicate someone has a MENA background. (Religion might also be a factor, but the Census Bureau does not publish data on religious groups.)
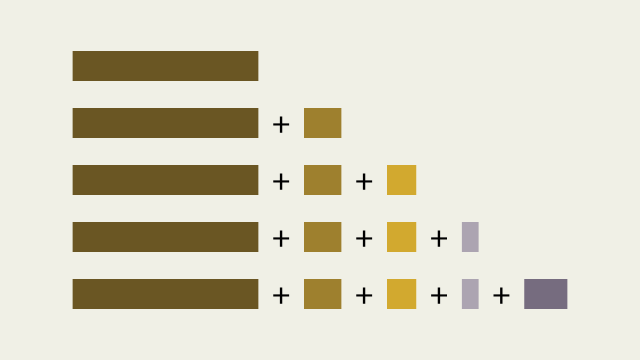
The size of the MENA population varies depending on how many of these factors are considered. Our estimates for 2024 range from 3.1 million to 5.2 million people, making up 0.9% to 1.5% of all people in the United States. (Read the methodology for more information on how we reached these estimates.)
MENA population estimate varies depending on the data used
Estimated U.S. Middle Eastern or North African (MENA) population, 2024

Note: Refer to the methodology for how each of these groups was defined. Groups can overlap, but each added group counts people who were not previously counted. MENA language-speaking population only includes people ages 5 and older.
Source: Pew Research Center analysis of the 2024 American Community Survey (IPUMS).
PEW RESEARCH CENTER
MENA population estimate varies depending on the data used
Estimated U.S. Middle Eastern or North African (MENA) population, 2024
| Var | Ancestry | Birthplace | Language | Race | Family relationships |
|---|---|---|---|---|---|
| Increment | 3,095,000 | 621,000 | 485,000 | 279,000 | 717,000 |
| Cumulative total | 3,095,000 | 3,716,000 | 4,201,000 | 4,481,000 | 5,197,000 |
Note: Refer to the methodology for how each of these groups was defined. Groups can overlap, but each added group counts people who were not previously counted. MENA language-speaking population only includes people ages 5 and older.
Source: Pew Research Center analysis of the 2024 American Community Survey (IPUMS).
PEW RESEARCH CENTER
3.1 million people are MENA by ancestry
This includes people who trace their ancestry or ethnic origin to places in the Middle East or North Africa.
2 million people are MENA by birthplace
This includes people born in a MENA country or region, as defined by Census Bureau. One challenge with relying only on birthplace to estimate the MENA population is that it doesn’t include the U.S.-born children of MENA immigrants or later generations of Americans with a MENA background.
When accounting for both ancestry and birthplace, the estimate grows to 3.7 million in 2024. This includes an additional 621,000 people born in MENA areas who did not report MENA ancestry.
2.3 million people are MENA by language
This includes people ages 5 and older in 2024 who spoke a MENA language like Arabic, Hebrew or Farsi at home. This measure comes with challenges, too: Not all people with a MENA background speak these languages, and people who are not MENA may speak them.
When considering ancestry, birthplace and language, the total estimated MENA population is 4.2 million, with language adding 485,000 people.
2.3 million people are MENA by race
This includes people who say their race is a MENA origin alone (for example, Syrian and no other race). It doesn’t include people who are MENA and at least one other race (for example, Syrian and Chinese) because the available data does not identify MENA races in combination with any other race.
When factoring in ancestry, birthplace, language and race, the total MENA population rises to 4.5 million in 2024. That includes 279,000 people reporting a MENA race who were not previously counted. (Note that this group can only be identified in the 2024 data.)
717,000 people are descendants of someone who is MENA
This group includes people who are not MENA by ancestry, birthplace, language or race but live with a parent or grandparent who has one or more of these MENA characteristics.
Family relationships add about 717,000 people, increasing the total number of people in the U.S. who are MENA to 5.2 million in 2024.
How much has the MENA population grown?
Using any of these measures, the MENA population in the U.S. has grown significantly in the last 50 years. In 1980, about 810,000 people reported MENA ancestry, and a combined 1.2 million reported MENA ancestry, birthplace, language or family relationship. The population has grown steadily since then.
Who identifies as MENA – and who doesn’t?
Not all ‘MENA’ groups identify as MENA equally
% of each origin group who, in the 2015 National Content Test, identified their race as Middle Eastern or North African (MENA) when given the option
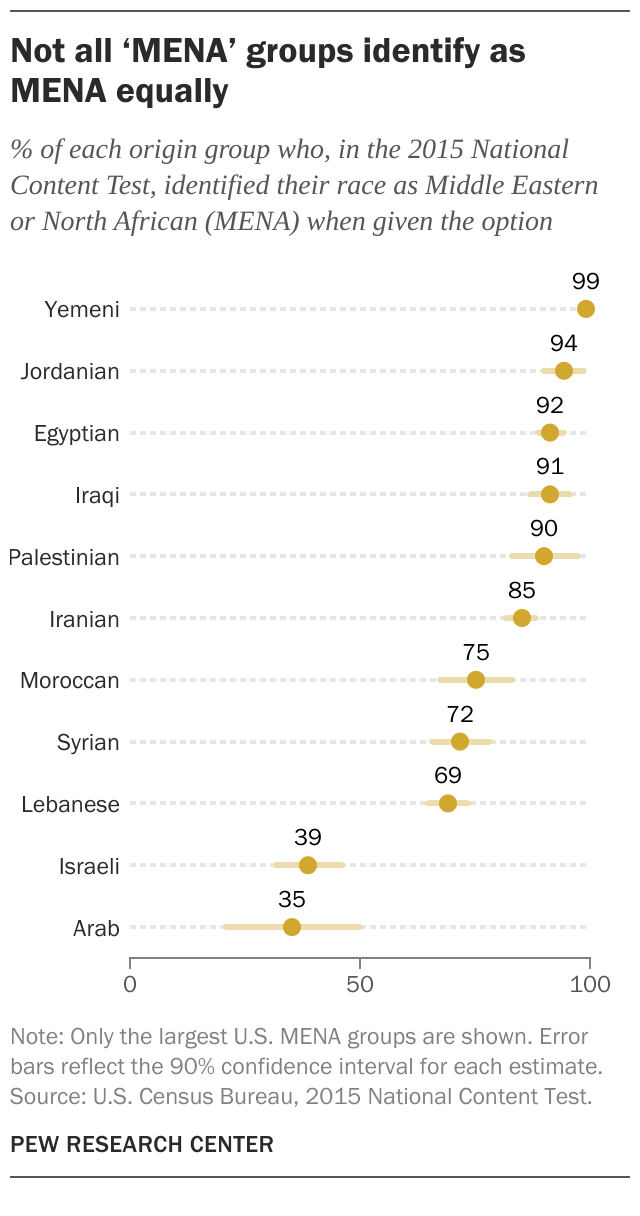
Note: Only the largest U.S. MENA groups are shown. Error bars reflect the 90% confidence interval for each estimate.
Source: U.S. Census Bureau, 2015 National Content Test.
PEW RESEARCH CENTER
Not all ‘MENA’ groups identify as MENA equally
% of each origin group who, in the 2015 National Content Test, identified their race as Middle Eastern or North African (MENA) when given the option
| Group | % MENA of group | 90% confidence interval |
Lower bound | Upper bound | Width | Standard error |
|---|---|---|---|---|---|---|
| Yemeni | 99.0 | ± 1.00 | 98.00 | 100.00 | 2.00 | 0.61 |
| Jordanian | 94.4 | ± 4.29 | 90.11 | 98.70 | 8.59 | 2.61 |
| Egyptian | 91.5 | ± 2.91 | 88.59 | 94.42 | 5.83 | 1.77 |
| Iraqi | 91.2 | ± 4.43 | 86.78 | 95.63 | 8.86 | 2.69 |
| Palestinian | 90.2 | ± 7.27 | 82.93 | 97.48 | 14.55 | 4.42 |
| Iranian | 85.0 | ± 3.16 | 81.85 | 88.16 | 6.32 | 1.92 |
| Moroccan | 75.2 | ± 7.91 | 67.29 | 83.12 | 15.83 | 4.81 |
| Syrian | 71.9 | ± 6.22 | 65.69 | 78.12 | 12.44 | 3.78 |
| Lebanese | 69.0 | ± 4.33 | 64.68 | 73.33 | 8.66 | 2.63 |
| Israeli | 38.9 | ± 7.25 | 31.65 | 46.16 | 14.51 | 4.41 |
| Arab | 35.4 | ± 14.56 | 20.85 | 49.96 | 29.12 | 8.85 |
Note: Only the largest U.S. MENA groups are shown. Error bars reflect the 90% confidence interval for each estimate.
Source: U.S. Census Bureau, 2015 National Content Test.
PEW RESEARCH CENTER
The Census Bureau’s definition of MENA groups has its critics. Still, large majorities of most MENA origin groups identify with the category, and most non-MENA groups do not.
In the 2015 NCT, Yemenis and Jordanians nearly unanimously reported their race as MENA when it was offered as a response option. A few other groups were more likely to identify as another race. For example, about half of Israelis and roughly a third of Arabs identified as White rather than MENA. Nonetheless, the Census Bureau included both groups in the MENA category.
‘Near-MENA’ groups
In 2024, an advisory committee recommended that the Census Bureau add Armenians to its MENA definition. The bureau declined, pointing out that only 13% of Armenians selected the MENA race category in the NCT.
We assessed how our 2024 MENA population estimate might be affected by adding groups that aren’t included in the bureau’s definition but have been considered. Armenians, Turks, Afghans and Somalis are among the groups we consider “near-MENA.”
- Using the narrowest definition (based only on ancestry), including these near-MENA groups would add 1.4 million people to our 3.1 million MENA population estimate.
- Using the broadest definition (based on ancestry, birthplace, language, race and family relationships) these inclusions would add 1.7 million people to our 5.2 million estimate.