
The internet represents a fundamental shift in how Americans connect with one another, gather information and conduct their day-to-day lives. For more than 25 years, Pew Research Center has documented the internet’s growth and distribution in the United States. Explore the patterns of internet and home broadband adoption below.
This fact sheet is the latest in our long-running series on technology adoption in the United States. For two decades, we’ve surveyed Americans on subjects like who subscribes to broadband – also known as high-speed internet – at home, who has a smartphone, how often people go online, and whether they rely on smartphones for internet.
Why did we do this?
Pew Research Center does research to inform the public, journalists and decision-makers. This research builds on our past work studying technology adoption and the digital divide in the United States.
Learn more about Pew Research Center.
How did we do this?
This analysis is based on findings from the National Public Opinion Reference Survey, a Center survey of 5,511 U.S. adults. We allowed people to respond online, by mail or by phone. The survey represents the views of all U.S. adults.
The survey was conducted Jan. 30-June 18, 2026. Its overall margin of error is plus or minus 1.8 percentage points.
This analysis also includes past data. The ways we’ve allowed people to respond to these surveys have evolved over the years, including in 2023 and again in 2024. For more on these shifts and how we approached them, read our mobile and social media fact sheets and our Q&A.
Here are the questions used for this analysis, the topline and the survey methodology.
Internet use over time
When the Center began asking Americans about their internet usage in early 2000, about half of all adults were already online. Today, 97% of U.S. adults say they use the internet.
Internet use
% of U.S. adults who say they use the internet
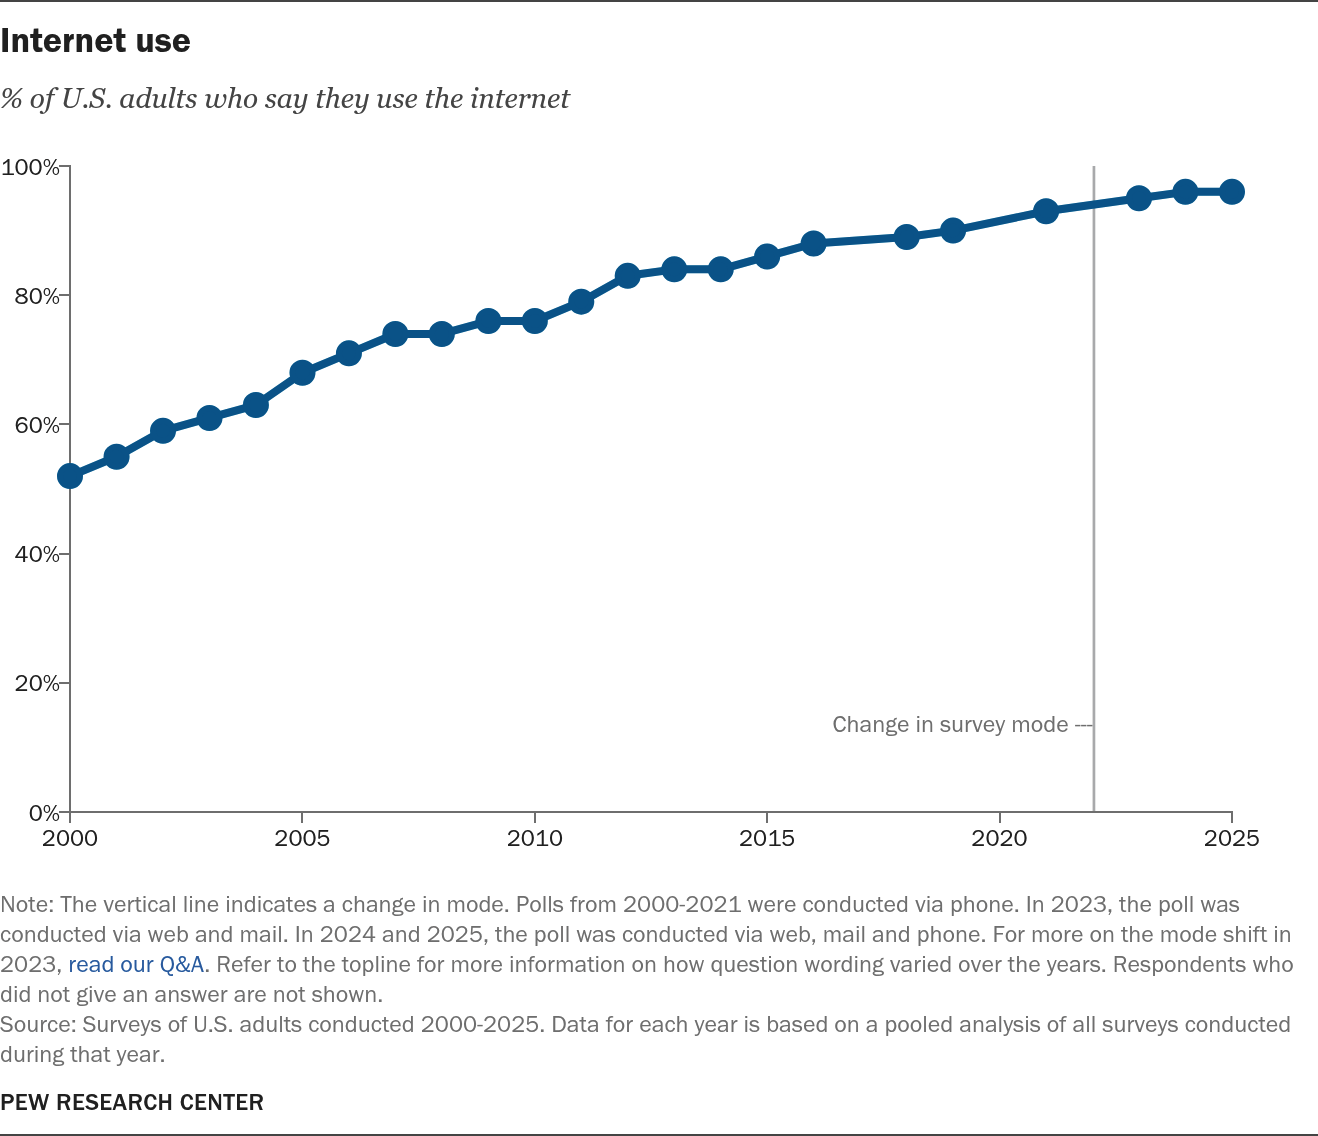
Source: Surveys of U.S. adults conducted 2000-2025. Data for each year is based on a pooled analysis of all surveys conducted during that year.
PEW RESEARCH CENTER
Internet use
% of U.S. adults who say they use the internet
| Year | U.S. adults |
|---|---|
| 2000 | 52% |
| 2001 | 55% |
| 2002 | 59% |
| 2003 | 61% |
| 2004 | 63% |
| 2005 | 68% |
| 2006 | 71% |
| 2007 | 74% |
| 2008 | 74% |
| 2009 | 76% |
| 2010 | 76% |
| 2011 | 79% |
| 2012 | 83% |
| 2013 | 84% |
| 2014 | 84% |
| 2015 | 86% |
| 2016 | 88% |
| 2018 | 89% |
| 2019 | 90% |
| 2021 | 93% |
| 2023 | 95% |
| 2024 | 96% |
| 2025 | 96% |
Source: Surveys of U.S. adults conducted 2000-2025. Data for each year is based on a pooled analysis of all surveys conducted during that year.
PEW RESEARCH CENTER

Who uses the internet?
For some demographic groups – such as younger adults, those with at least some college education and those from high-income households – internet usage is near universal.
Tab Contents
Internet use by age
% of U.S. adults who say they use the internet, by age
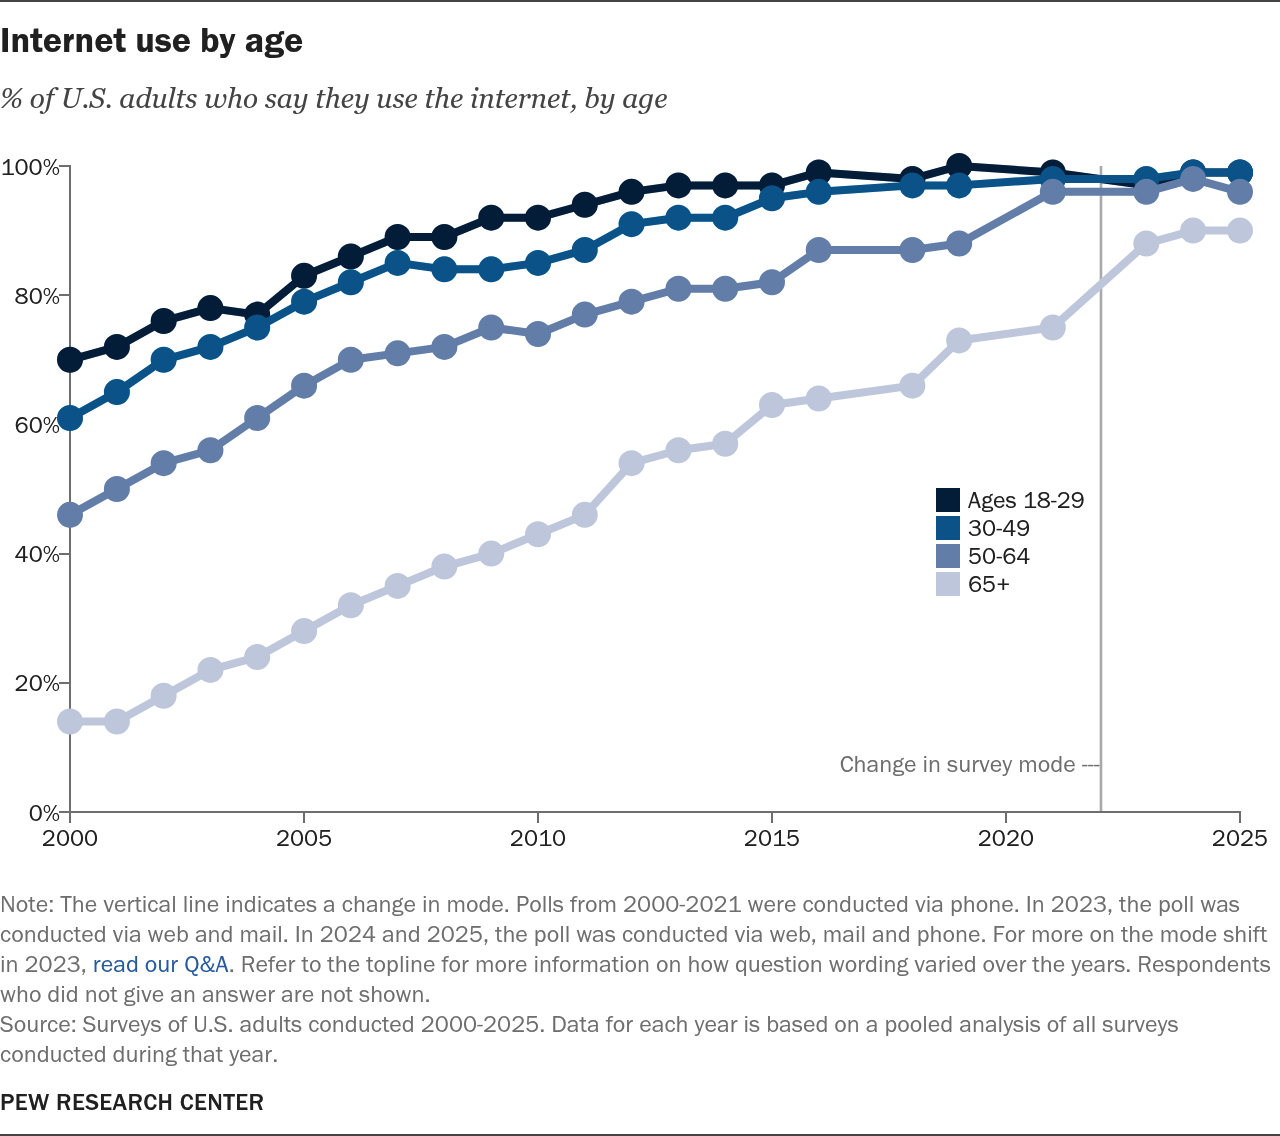
Source: Surveys of U.S. adults conducted 2000-2026. Data for each year is based on a pooled analysis of all surveys conducted during that year.
PEW RESEARCH CENTER
Internet use by age
% of U.S. adults who say they use the internet, by age
| Year | Ages 18-29 | 30-49 | 50-64 | 65+ |
|---|---|---|---|---|
| 2000 | 70% | 61% | 46% | 14% |
| 2001 | 72% | 65% | 50% | 14% |
| 2002 | 76% | 70% | 54% | 18% |
| 2003 | 78% | 72% | 56% | 22% |
| 2004 | 77% | 75% | 61% | 24% |
| 2005 | 83% | 79% | 66% | 28% |
| 2006 | 86% | 82% | 70% | 32% |
| 2007 | 89% | 85% | 71% | 35% |
| 2008 | 89% | 84% | 72% | 38% |
| 2009 | 92% | 84% | 75% | 40% |
| 2010 | 92% | 85% | 74% | 43% |
| 2011 | 94% | 87% | 77% | 46% |
| 2012 | 96% | 91% | 79% | 54% |
| 2013 | 97% | 92% | 81% | 56% |
| 2014 | 97% | 92% | 81% | 57% |
| 2015 | 97% | 95% | 82% | 63% |
| 2016 | 99% | 96% | 87% | 64% |
| 2018 | 98% | 97% | 87% | 66% |
| 2019 | 100% | 97% | 88% | 73% |
| 2021 | 99% | 98% | 96% | 75% |
| 2023 | 97% | 98% | 96% | 88% |
| 2024 | 99% | 99% | 98% | 90% |
| 2025 | 99% | 99% | 96% | 90% |
| 2026 | 99% | 99% | 98% | 89% |
Source: Surveys of U.S. adults conducted 2000-2026. Data for each year is based on a pooled analysis of all surveys conducted during that year.
PEW RESEARCH CENTER
Internet use by race and ethnicity
% of U.S. adults who say they use the internet, by race and ethnicity
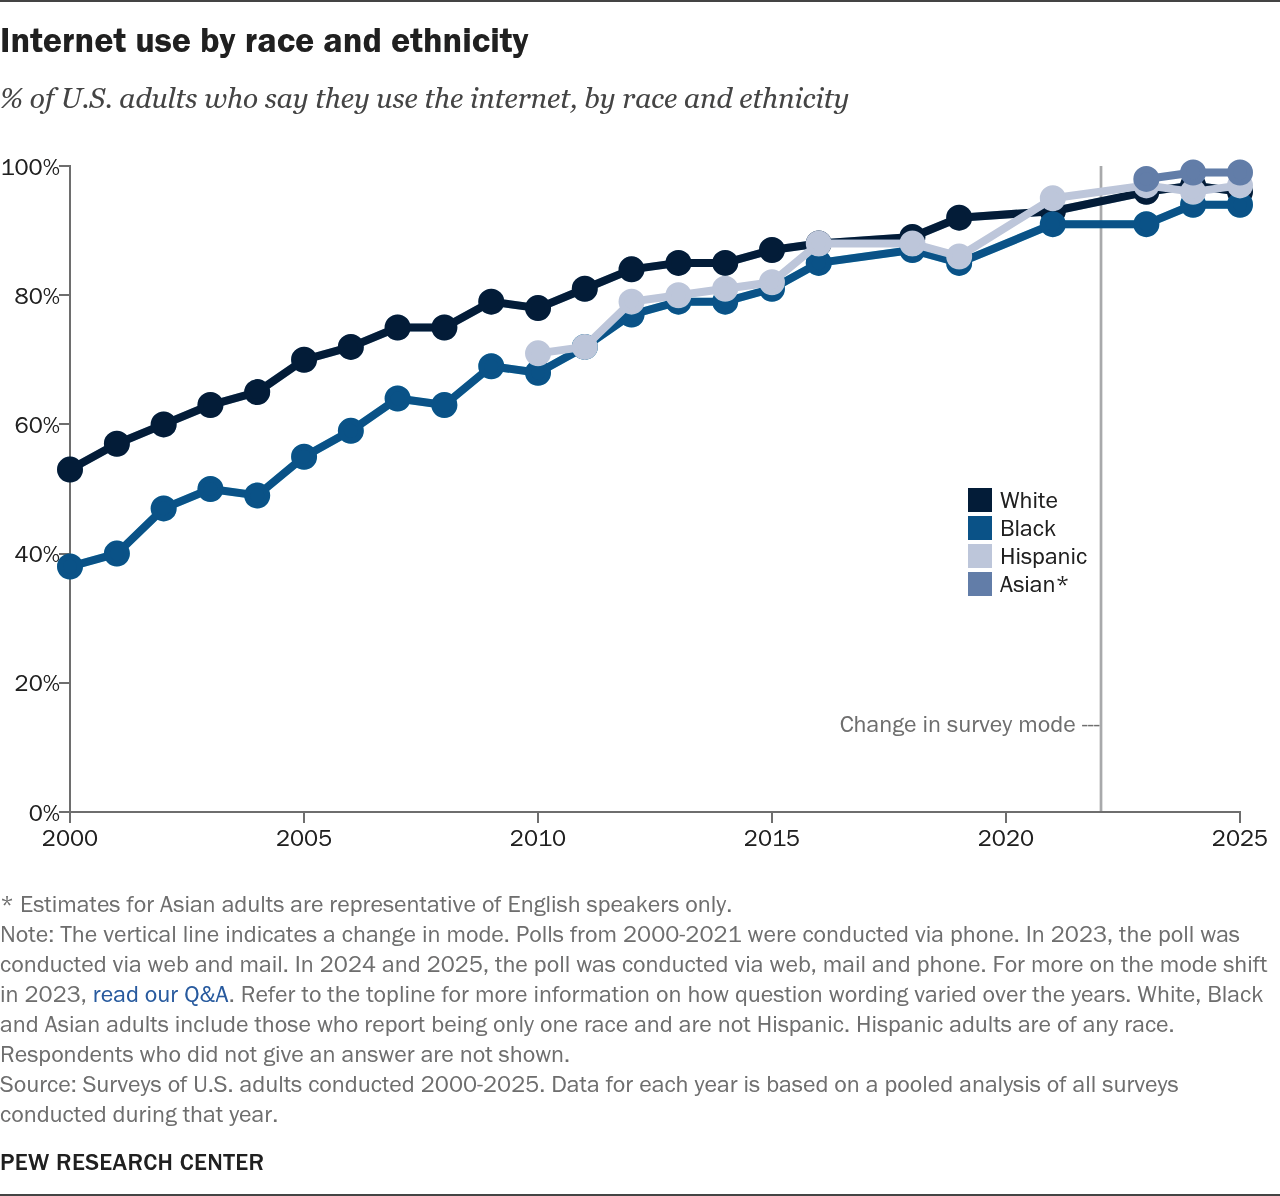
Note: The vertical line indicates a change in mode. Polls from 2000-2021 were conducted via phone. In 2023, the poll was conducted via web and mail. In 2024 through 2026, the poll was conducted via web, mail and phone. For more on the mode shift in 2023, read our Q&A. Refer to the topline for more information on how question wording varied over the years. White, Black and Asian adults include those who report being only one race and are not Hispanic. Hispanics are of any race. Respondents who did not give an answer are not shown.
Source: Surveys of U.S. adults conducted 2000-2026. Data for each year is based on a pooled analysis of all surveys conducted during that year.
PEW RESEARCH CENTER
Internet use by race and ethnicity
% of U.S. adults who say they use the internet, by race and ethnicity
| Year | White | Hispanic | Black | Asian* |
|---|---|---|---|---|
| 2000 | 53% | 38% | ||
| 2001 | 57% | 40% | ||
| 2002 | 60% | 47% | ||
| 2003 | 63% | 50% | ||
| 2004 | 65% | 49% | ||
| 2005 | 70% | 55% | ||
| 2006 | 72% | 59% | ||
| 2007 | 75% | 64% | ||
| 2008 | 75% | 63% | ||
| 2009 | 79% | 69% | ||
| 2010 | 78% | 71% | 68% | |
| 2011 | 81% | 72% | 72% | |
| 2012 | 84% | 79% | 77% | |
| 2013 | 85% | 80% | 79% | |
| 2014 | 85% | 81% | 79% | |
| 2015 | 87% | 82% | 81% | |
| 2016 | 88% | 88% | 85% | |
| 2018 | 89% | 88% | 87% | |
| 2019 | 92% | 86% | 85% | |
| 2021 | 93% | 95% | 91% | |
| 2023 | 96% | 97% | 91% | 98% |
| 2024 | 97% | 96% | 94% | 99% |
| 2025 | 96% | 97% | 94% | 99% |
| 2026 | 97% | 96% | 93% | 98% |
Note: The vertical line indicates a change in mode. Polls from 2000-2021 were conducted via phone. In 2023, the poll was conducted via web and mail. In 2024 through 2026, the poll was conducted via web, mail and phone. For more on the mode shift in 2023, read our Q&A. Refer to the topline for more information on how question wording varied over the years. White, Black and Asian adults include those who report being only one race and are not Hispanic. Hispanics are of any race. Respondents who did not give an answer are not shown.
Source: Surveys of U.S. adults conducted 2000-2026. Data for each year is based on a pooled analysis of all surveys conducted during that year.
PEW RESEARCH CENTER
Internet use by gender
% of U.S. adults who say they use the internet, by gender
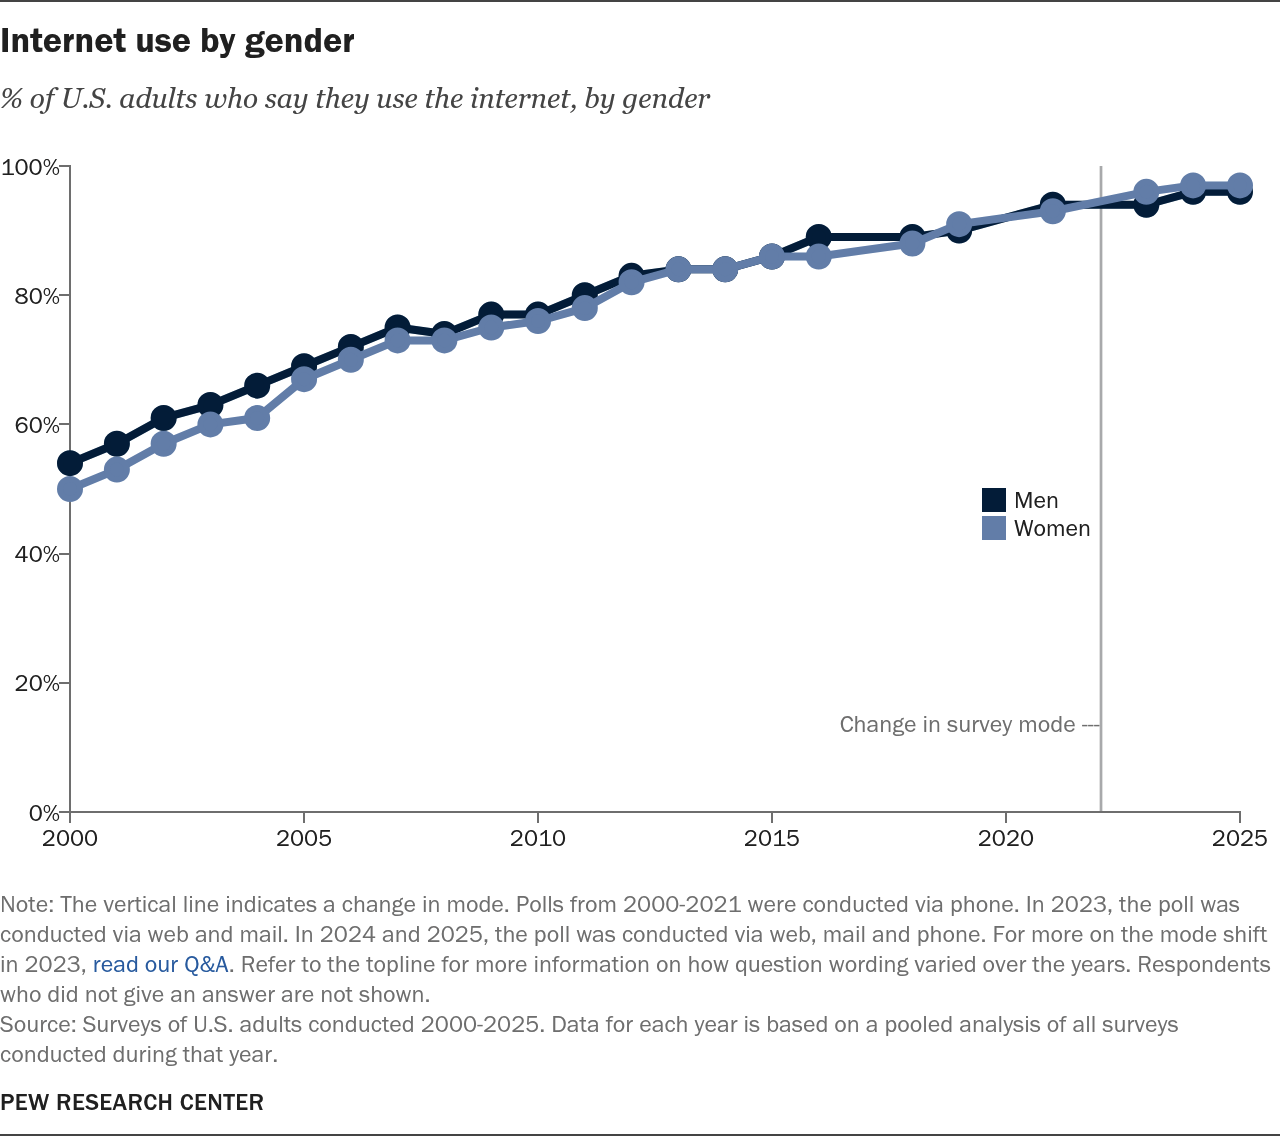
Source: Surveys of U.S. adults conducted 2000-2026. Data for each year is based on a pooled analysis of all surveys conducted during that year.
PEW RESEARCH CENTER
Internet use by gender
% of U.S. adults who say they use the internet, by gender
| Year | Men | Women |
|---|---|---|
| 2000 | 54% | 50% |
| 2001 | 57% | 53% |
| 2002 | 61% | 57% |
| 2003 | 63% | 60% |
| 2004 | 66% | 61% |
| 2005 | 69% | 67% |
| 2006 | 72% | 70% |
| 2007 | 75% | 73% |
| 2008 | 74% | 73% |
| 2009 | 77% | 75% |
| 2010 | 77% | 76% |
| 2011 | 80% | 78% |
| 2012 | 83% | 82% |
| 2013 | 84% | 84% |
| 2014 | 84% | 84% |
| 2015 | 86% | 86% |
| 2016 | 89% | 86% |
| 2018 | 89% | 88% |
| 2019 | 90% | 91% |
| 2021 | 94% | 93% |
| 2023 | 94% | 96% |
| 2024 | 96% | 97% |
| 2025 | 96% | 97% |
| 2026 | 96% | 97% |
Source: Surveys of U.S. adults conducted 2000-2026. Data for each year is based on a pooled analysis of all surveys conducted during that year.
PEW RESEARCH CENTER
Internet use by income
% of U.S. adults who say they use the internet, by annual household income
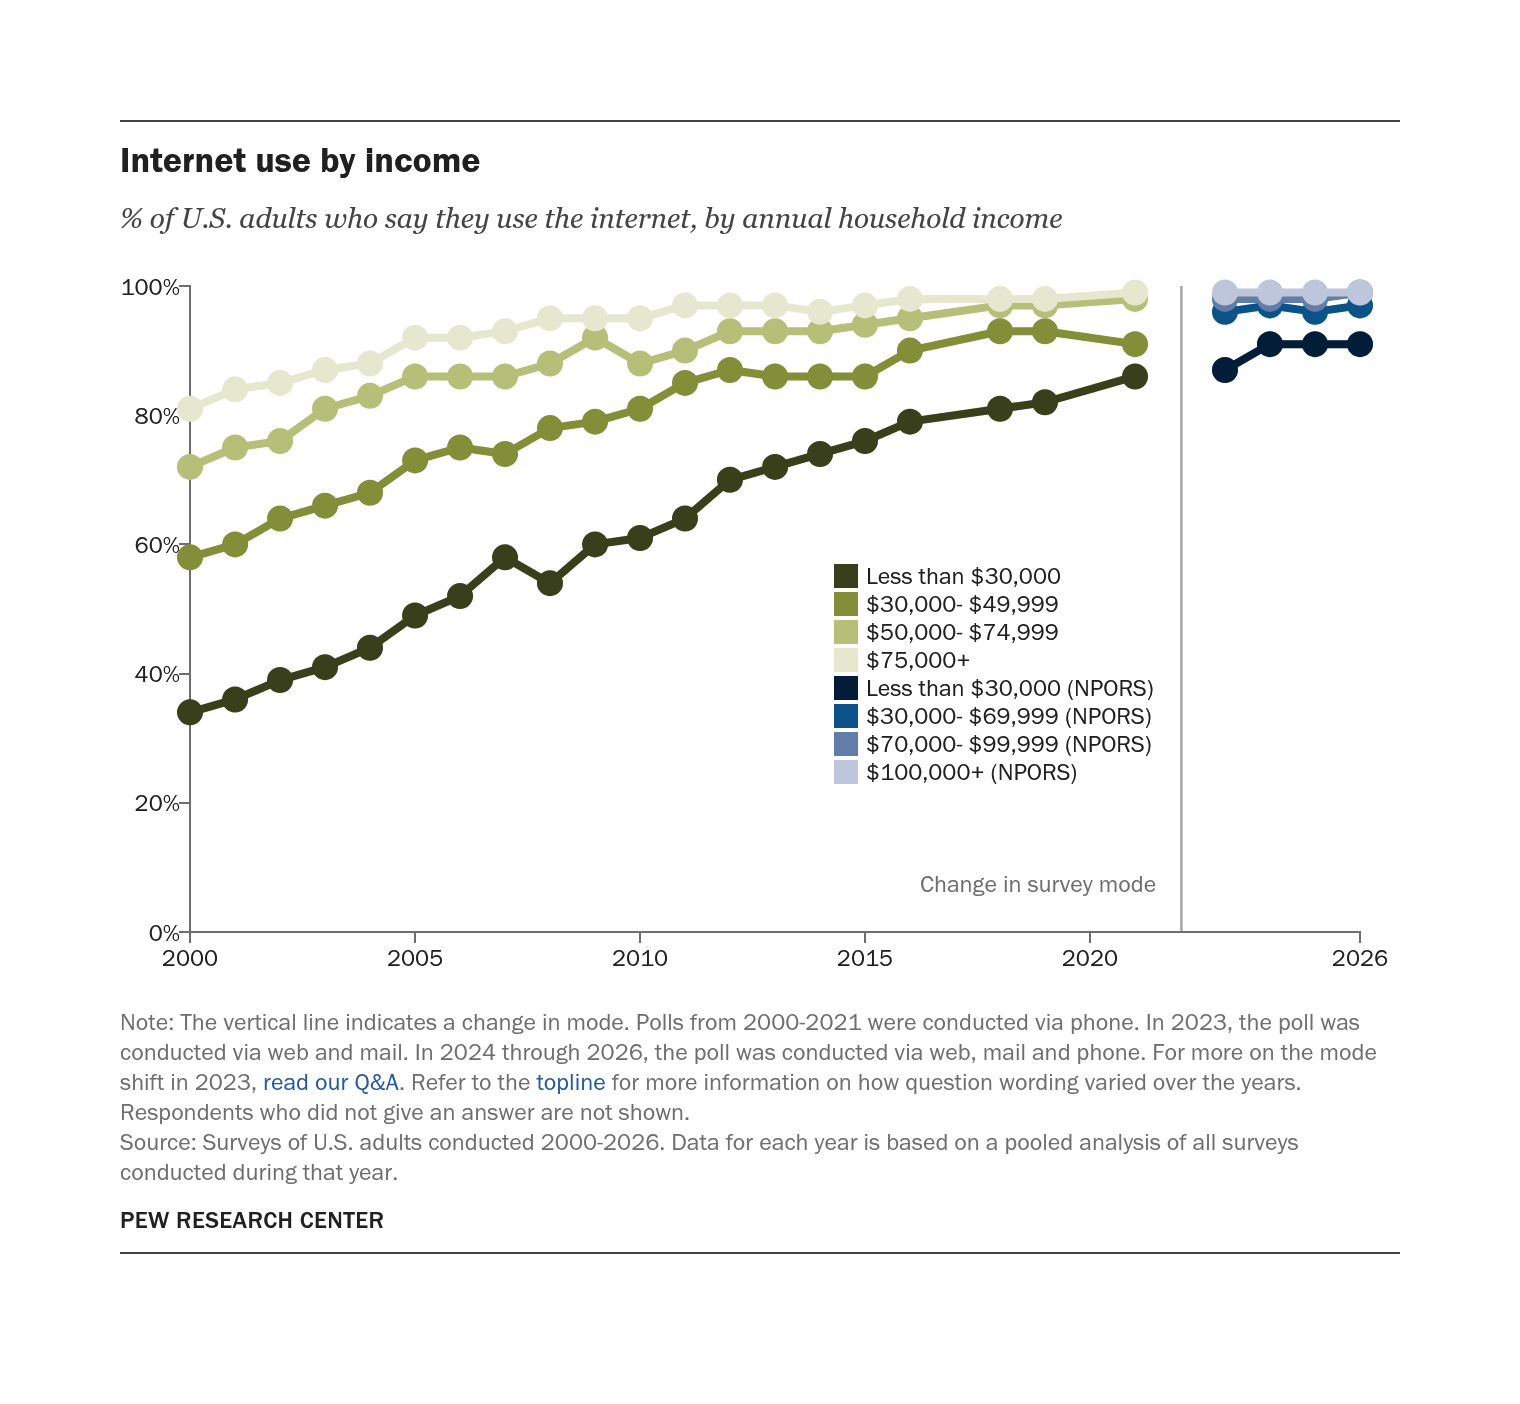
Source: Surveys of U.S. adults conducted 2000-2026. Data for each year is based on a pooled analysis of all surveys conducted during that year.
PEW RESEARCH CENTER
Internet use by income
% of U.S. adults who say they use the internet, by annual household income
| Year | Less than $30,000 | $30,000- $49,999 | $50,000- $74,999 | $75,000+ | Less than $30,000 (NPORS) | $30,000- $69,999 (NPORS) | $70,000- $99,999 (NPORS) | $100,000+ (NPORS) |
|---|---|---|---|---|---|---|---|---|
| 2000 | 34% | 58% | 72% | 81% | ||||
| 2001 | 36% | 60% | 75% | 84% | ||||
| 2002 | 39% | 64% | 76% | 85% | ||||
| 2003 | 41% | 66% | 81% | 87% | ||||
| 2004 | 44% | 68% | 83% | 88% | ||||
| 2005 | 49% | 73% | 86% | 92% | ||||
| 2006 | 52% | 75% | 86% | 92% | ||||
| 2007 | 58% | 74% | 86% | 93% | ||||
| 2008 | 54% | 78% | 88% | 95% | ||||
| 2009 | 60% | 79% | 92% | 95% | ||||
| 2010 | 61% | 81% | 88% | 95% | ||||
| 2011 | 64% | 85% | 90% | 97% | ||||
| 2012 | 70% | 87% | 93% | 97% | ||||
| 2013 | 72% | 86% | 93% | 97% | ||||
| 2014 | 74% | 86% | 93% | 96% | ||||
| 2015 | 76% | 86% | 94% | 97% | ||||
| 2016 | 79% | 90% | 95% | 98% | ||||
| 2018 | 81% | 93% | 97% | 98% | ||||
| 2019 | 82% | 93% | 97% | 98% | ||||
| 2021 | 86% | 91% | 98% | 99% | ||||
| 2023 | 87% | 96% | 98% | 99% | ||||
| 2024 | 91% | 97% | 98% | 99% | ||||
| 2025 | 91% | 96% | 98% | 99% | ||||
| 2026 | 91% | 97% | 99% | 99% |
Source: Surveys of U.S. adults conducted 2000-2026. Data for each year is based on a pooled analysis of all surveys conducted during that year.
PEW RESEARCH CENTER
Internet use by education
% of U.S. adults who use the internet, by education level
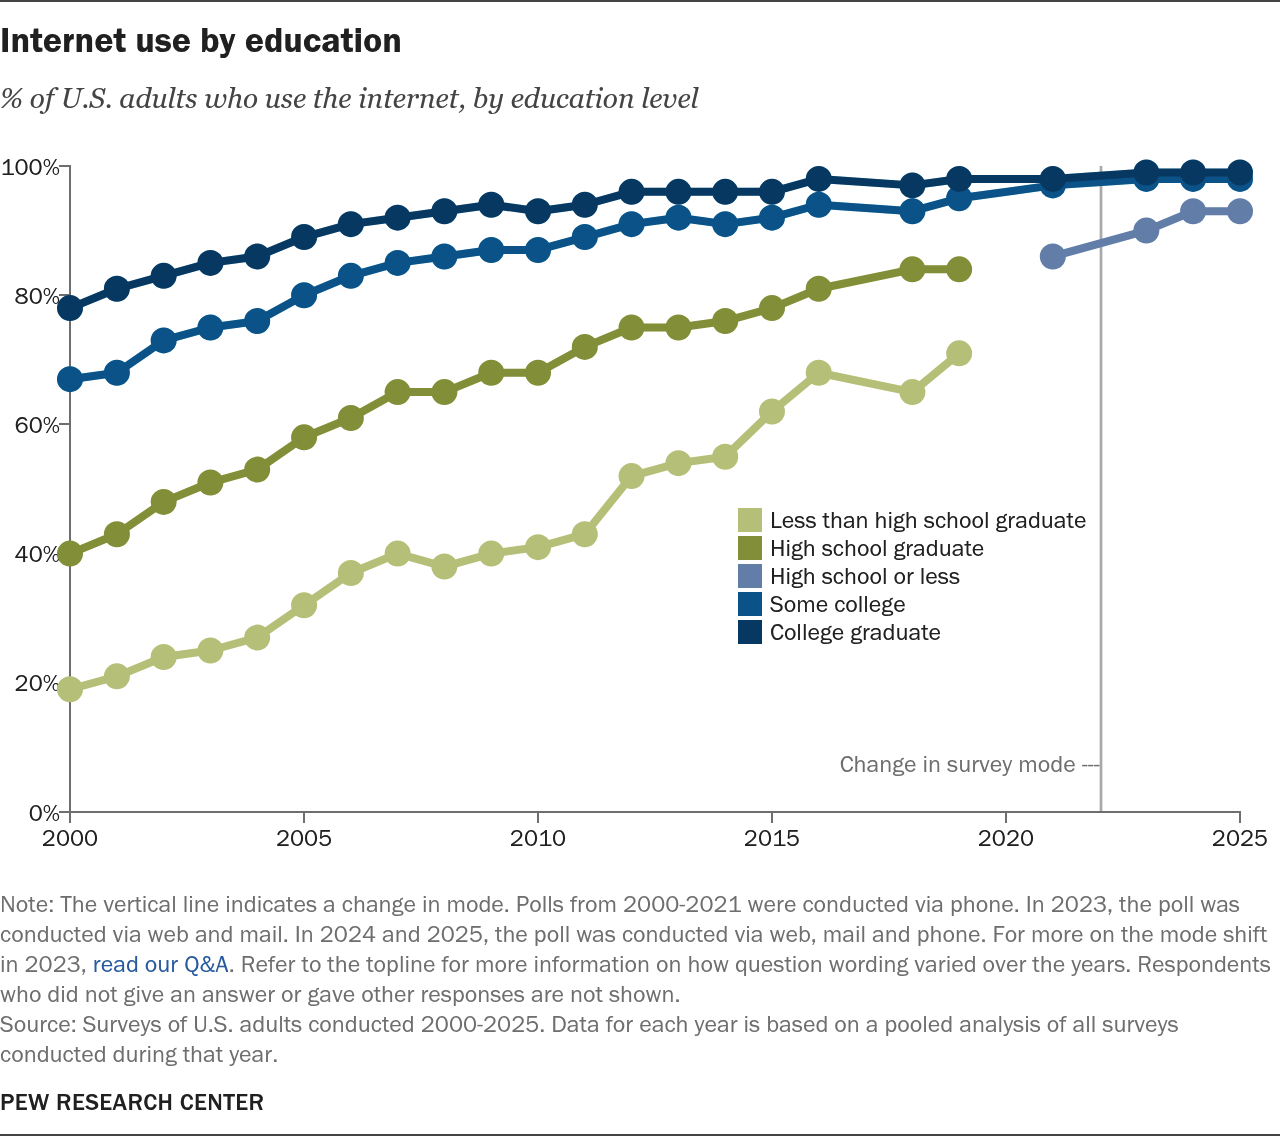
Source: Surveys of U.S. adults conducted 2000-2026. Data for each year is based on a pooled analysis of all surveys conducted during that year.
PEW RESEARCH CENTER
Internet use by education
% of U.S. adults who use the internet, by education level
| Year | Less than high school graduate | High school graduate | High school or less | Some college | College graduate |
|---|---|---|---|---|---|
| 2000 | 19% | 40% | 67% | 78% | |
| 2001 | 21% | 43% | 68% | 81% | |
| 2002 | 24% | 48% | 73% | 83% | |
| 2003 | 25% | 51% | 75% | 85% | |
| 2004 | 27% | 53% | 76% | 86% | |
| 2005 | 32% | 58% | 80% | 89% | |
| 2006 | 37% | 61% | 83% | 91% | |
| 2007 | 40% | 65% | 85% | 92% | |
| 2008 | 38% | 65% | 86% | 93% | |
| 2009 | 40% | 68% | 87% | 94% | |
| 2010 | 41% | 68% | 87% | 93% | |
| 2011 | 43% | 72% | 89% | 94% | |
| 2012 | 52% | 75% | 91% | 96% | |
| 2013 | 54% | 75% | 92% | 96% | |
| 2014 | 55% | 76% | 91% | 96% | |
| 2015 | 62% | 78% | 92% | 96% | |
| 2016 | 68% | 81% | 94% | 98% | |
| 2018 | 65% | 84% | 93% | 97% | |
| 2019 | 71% | 84% | 95% | 98% | |
| 2021 | 86% | 97% | 98% | ||
| 2023 | 90% | 98% | 99% | ||
| 2024 | 93% | 98% | 99% | ||
| 2025 | 93% | 98% | 99% | ||
| 2026 | 93% | 98% | 99% |
Source: Surveys of U.S. adults conducted 2000-2026. Data for each year is based on a pooled analysis of all surveys conducted during that year.
PEW RESEARCH CENTER

Home broadband use over time
The share of U.S. adults with high-speed broadband service at home increased rapidly between 2000 and 2010. And that growth continues today: 78% of U.S. adults now say they subscribe to a broadband internet service at home.
Home broadband use
% of U.S. adults who say they subscribe to home broadband
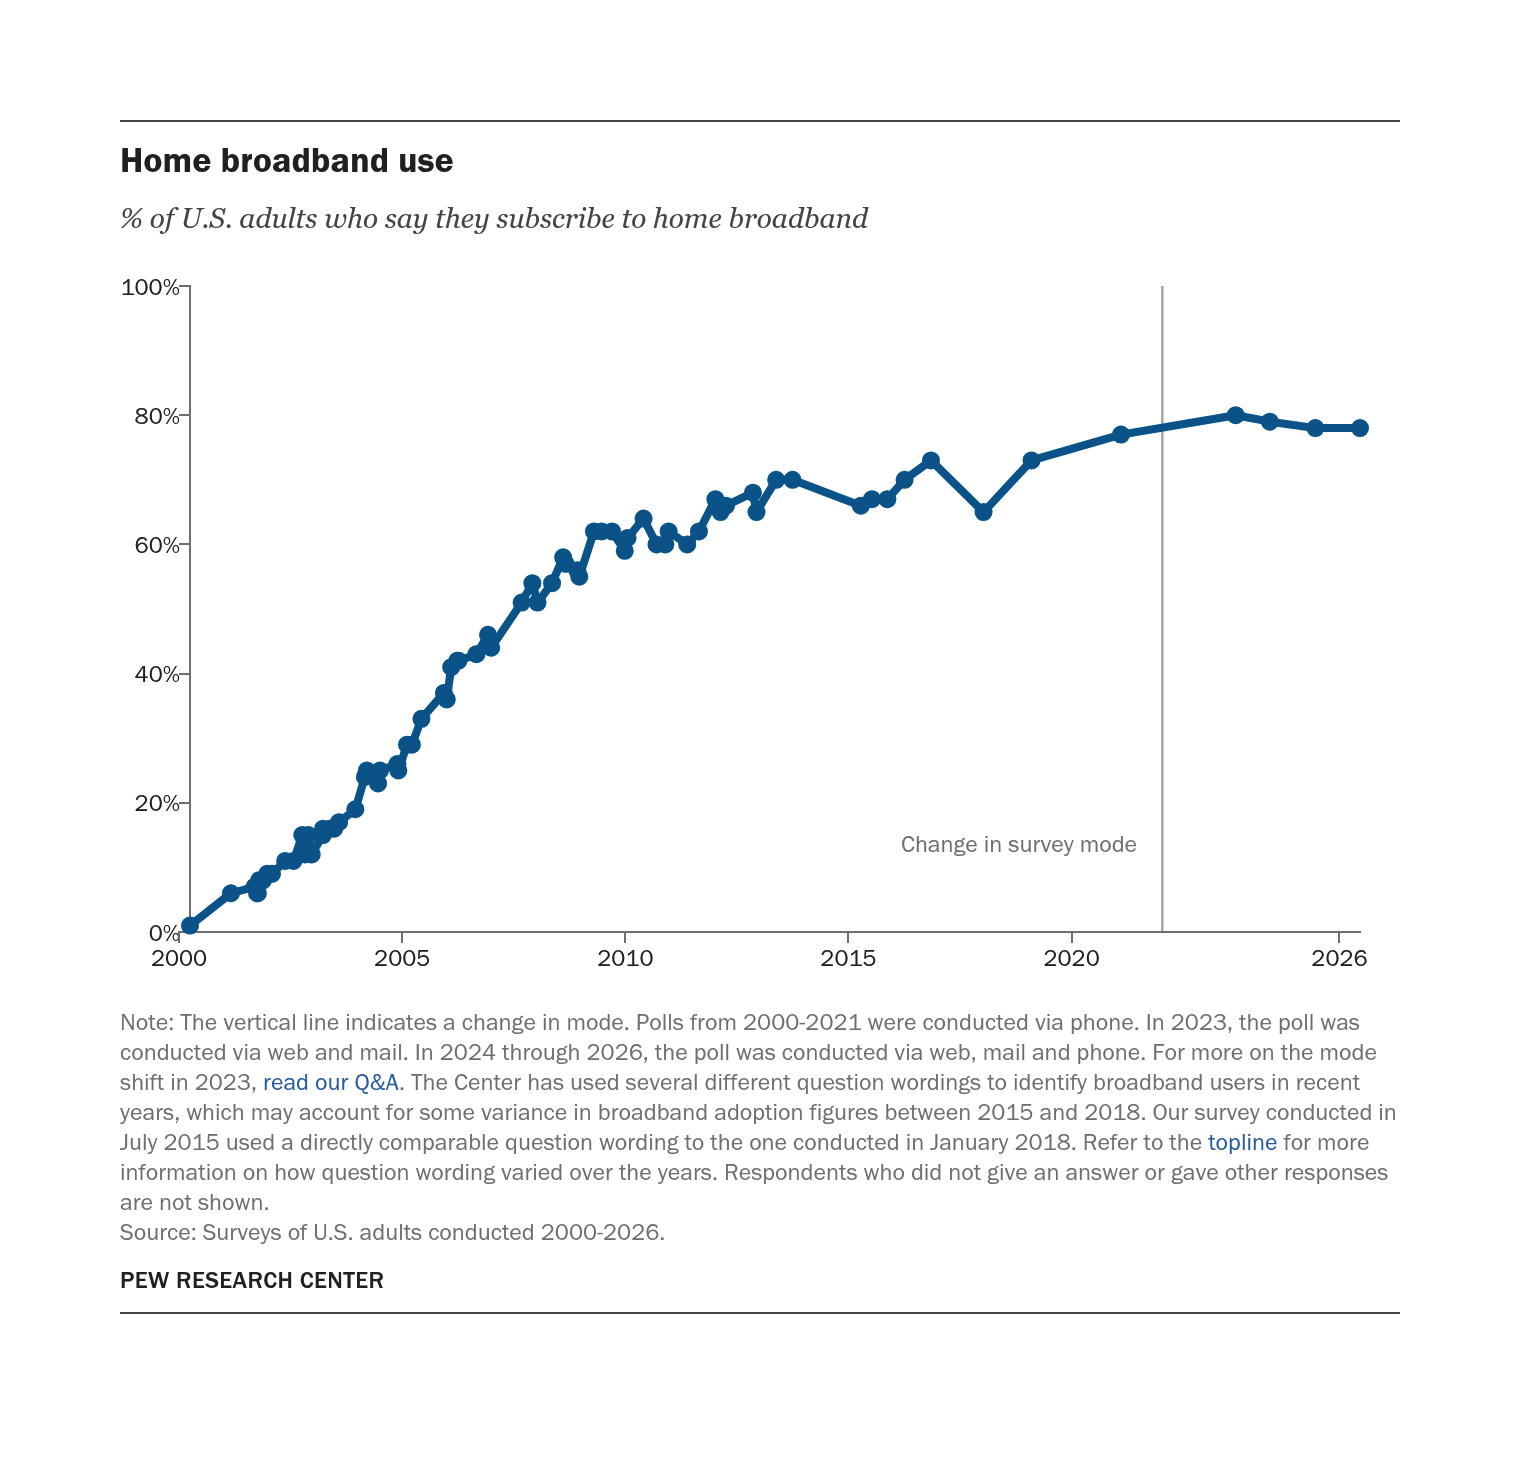
Source: Surveys of U.S. adults conducted 2000-2026.
PEW RESEARCH CENTER
Home broadband use
% of U.S. adults who say they subscribe to home broadband
| U.S. adults | |
|---|---|
| 3/31/2000 | 1% |
| 3/1/2001 | 6% |
| 9/10/2001 | 7% |
| 9/19/2001 | 7% |
| 10/1/2001 | 6% |
| 10/7/2001 | 6% |
| 10/18/2001 | 8% |
| 11/18/2001 | 8% |
| 12/23/2001 | 9% |
| 1/31/2002 | 9% |
| 5/19/2002 | 11% |
| 7/26/2002 | 11% |
| 10/6/2002 | 15% |
| 10/27/2002 | 12% |
| 11/24/2002 | 15% |
| 12/22/2002 | 12% |
| 3/24/2003 | 15% |
| 3/25/2003 | 16% |
| 5/20/2003 | 16% |
| 6/24/2003 | 16% |
| 8/3/2003 | 17% |
| 12/14/2003 | 19% |
| 3/1/2004 | 24% |
| 3/17/2004 | 25% |
| 6/17/2004 | 23% |
| 7/3/2004 | 25% |
| 11/22/2004 | 26% |
| 11/30/2004 | 25% |
| 2/9/2005 | 29% |
| 3/21/2005 | 29% |
| 6/7/2005 | 33% |
| 12/8/2005 | 37% |
| 12/31/2005 | 36% |
| 2/6/2006 | 41% |
| 3/28/2006 | 42% |
| 4/6/2006 | 42% |
| 8/31/2006 | 43% |
| 12/4/2006 | 46% |
| 12/30/2006 | 44% |
| 9/5/2007 | 51% |
| 12/2/2007 | 54% |
| 1/13/2008 | 51% |
| 5/11/2008 | 54% |
| 8/10/2008 | 58% |
| 8/31/2008 | 57% |
| 12/4/2008 | 56% |
| 12/20/2008 | 55% |
| 4/19/2009 | 62% |
| 6/21/2009 | 62% |
| 9/14/2009 | 62% |
| 12/27/2009 | 59% |
| 1/19/2010 | 61% |
| 5/30/2010 | 64% |
| 9/13/2010 | 60% |
| 11/24/2010 | 60% |
| 12/21/2010 | 62% |
| 5/22/2011 | 60% |
| 8/26/2011 | 62% |
| 1/8/2012 | 67% |
| 2/19/2012 | 65% |
| 4/3/2012 | 66% |
| 11/10/2012 | 68% |
| 12/9/2012 | 65% |
| 5/19/2013 | 70% |
| 9/30/2013 | 70% |
| 4/12/2015 | 66% |
| 7/12/2015 | 67% |
| 11/15/2015 | 67% |
| 4/4/2016 | 70% |
| 11/6/2016 | 73% |
| 1/10/2018 | 65% |
| 2/7/2019 | 73% |
| 2/8/2021 | 77% |
| 9/5/2023 | 80% |
| 6/10/2024 | 79% |
| 6/18/2025 | 78% |
| 6/18/2026 | 78% |
Source: Surveys of U.S. adults conducted 2000-2026.
PEW RESEARCH CENTER
Who has home broadband?
As is true of internet adoption more broadly, home broadband adoption varies across demographic groups. For instance, those with lower income levels and formal education are less likely to say they subscribe to a broadband service at home.
Tab Contents
Home broadband use by age
% of U.S. adults who say they subscribe to home broadband, by age
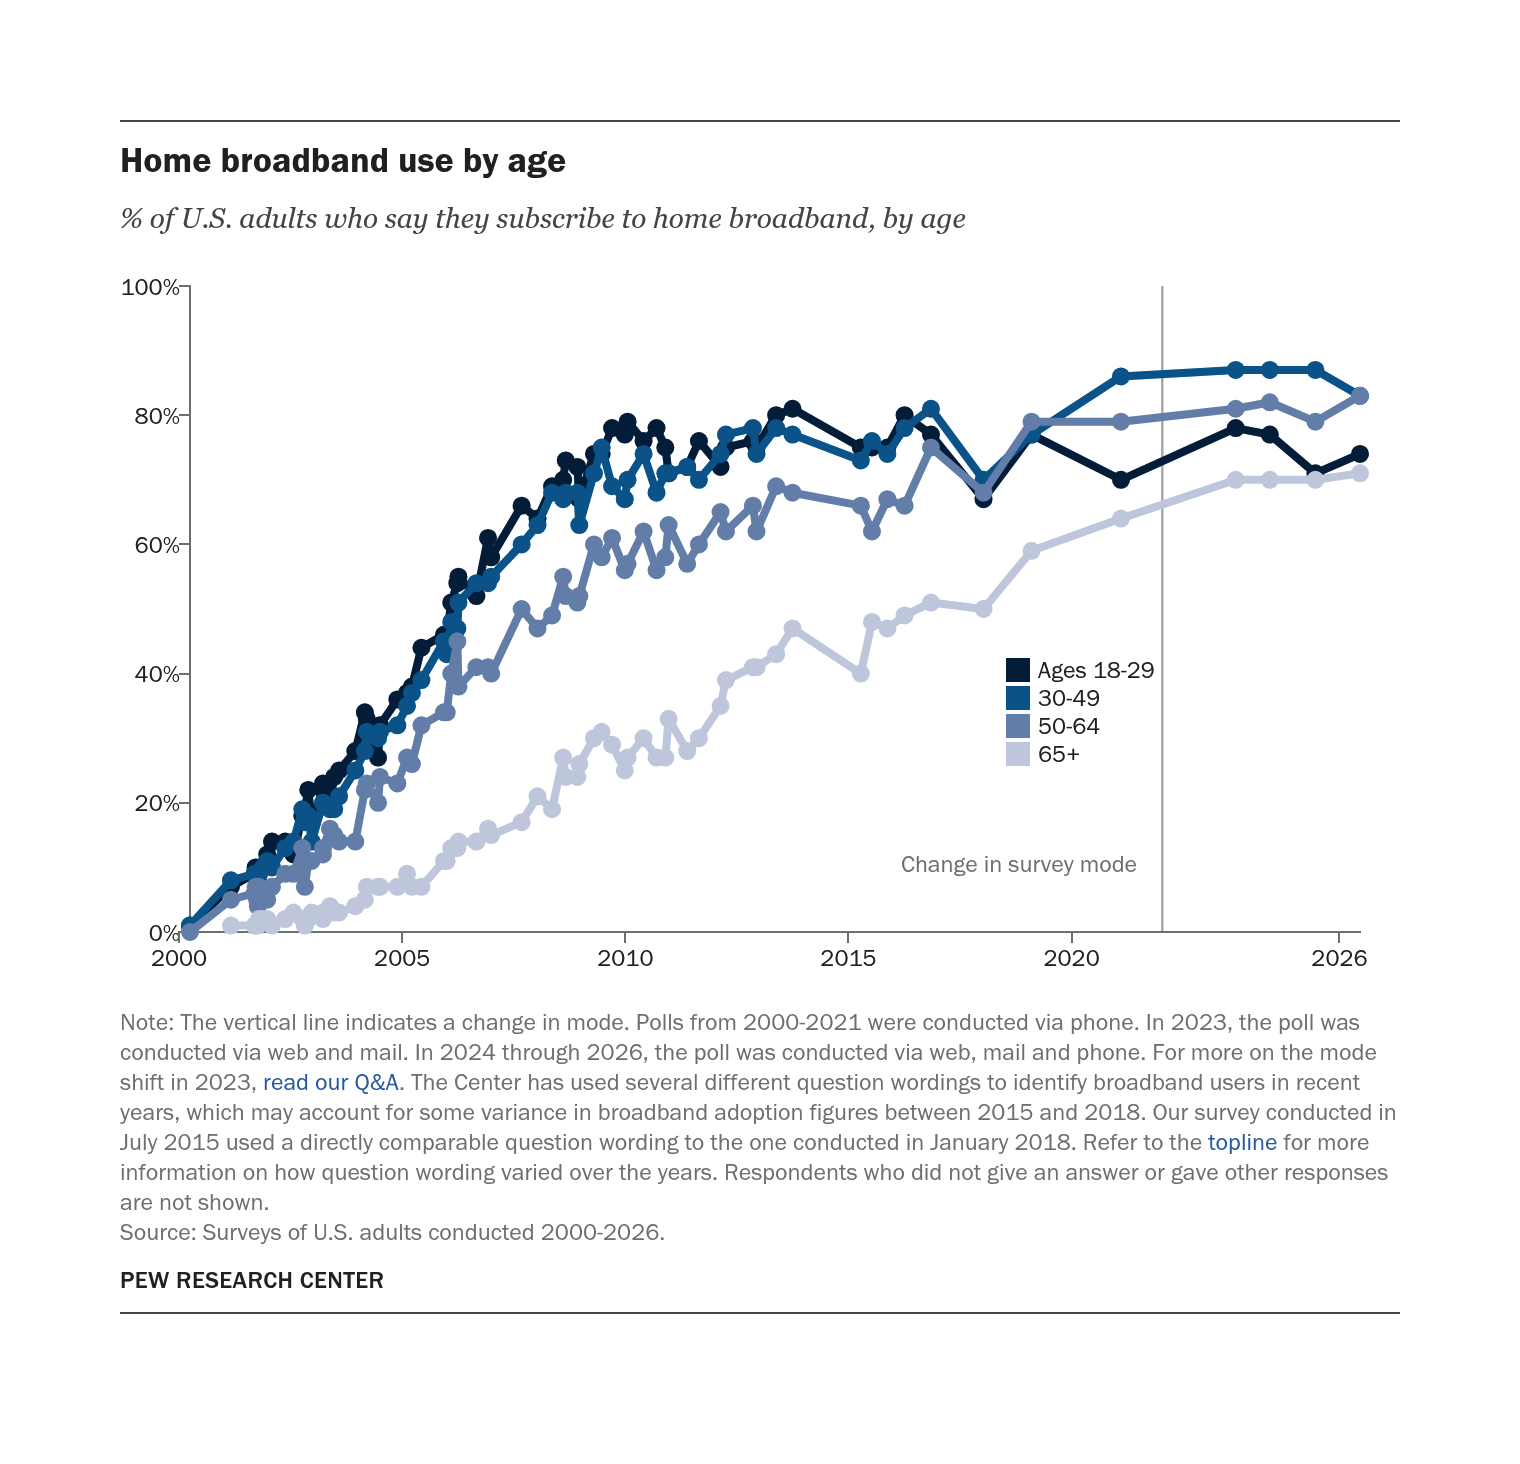
Source: Surveys of U.S. adults conducted 2000-2026.
PEW RESEARCH CENTER
Home broadband use by age
% of U.S. adults who say they subscribe to home broadband, by age
| Ages 18-29 | 30-49 | 50-64 | 65+ | |
|---|---|---|---|---|
| 3/31/2000 | 1% | 1% | 0% | |
| 3/1/2001 | 7% | 8% | 5% | 1% |
| 9/10/2001 | 9% | 9% | 6% | 1% |
| 9/19/2001 | 10% | 9% | 7% | 1% |
| 10/1/2001 | 8% | 8% | 5% | |
| 10/7/2001 | 8% | 9% | 4% | 1% |
| 10/18/2001 | 10% | 9% | 7% | 2% |
| 11/18/2001 | 10% | 10% | 5% | 2% |
| 12/23/2001 | 12% | 11% | 5% | 2% |
| 1/31/2002 | 14% | 10% | 7% | 1% |
| 5/19/2002 | 14% | 13% | 9% | 2% |
| 7/26/2002 | 12% | 14% | 9% | 3% |
| 10/6/2002 | 18% | 19% | 13% | 2% |
| 10/27/2002 | 19% | 17% | 7% | 1% |
| 11/24/2002 | 22% | 18% | 11% | 2% |
| 12/22/2002 | 17% | 14% | 11% | 3% |
| 3/24/2003 | 22% | 20% | 12% | 2% |
| 3/25/2003 | 23% | 20% | 13% | 3% |
| 5/20/2003 | 20% | 19% | 16% | 4% |
| 6/24/2003 | 24% | 19% | 15% | 3% |
| 8/3/2003 | 25% | 21% | 14% | 3% |
| 12/14/2003 | 28% | 25% | 14% | 4% |
| 3/1/2004 | 34% | 28% | 22% | 5% |
| 3/17/2004 | 33% | 31% | 23% | 7% |
| 6/17/2004 | 27% | 30% | 20% | 7% |
| 7/3/2004 | 32% | 31% | 24% | 7% |
| 11/22/2004 | 36% | 32% | 23% | 7% |
| 2/9/2005 | 37% | 35% | 27% | 9% |
| 3/21/2005 | 38% | 37% | 26% | 7% |
| 6/7/2005 | 44% | 39% | 32% | 7% |
| 12/8/2005 | 46% | 45% | 34% | 11% |
| 12/31/2005 | 46% | 43% | 34% | 11% |
| 2/6/2006 | 51% | 48% | 40% | 13% |
| 3/28/2006 | 54% | 47% | 45% | 13% |
| 4/6/2006 | 55% | 51% | 38% | 14% |
| 8/31/2006 | 52% | 54% | 41% | 14% |
| 12/4/2006 | 61% | 54% | 41% | 16% |
| 12/30/2006 | 58% | 55% | 40% | 15% |
| 9/5/2007 | 66% | 60% | 50% | 17% |
| 1/13/2008 | 64% | 63% | 47% | 21% |
| 5/11/2008 | 69% | 68% | 49% | 19% |
| 8/10/2008 | 70% | 67% | 55% | 27% |
| 8/31/2008 | 73% | 68% | 52% | 24% |
| 12/4/2008 | 72% | 68% | 51% | 24% |
| 12/20/2008 | 67% | 63% | 52% | 26% |
| 4/19/2009 | 74% | 71% | 60% | 30% |
| 6/21/2009 | 74% | 75% | 58% | 31% |
| 9/14/2009 | 78% | 69% | 61% | 29% |
| 12/27/2009 | 77% | 67% | 56% | 25% |
| 1/19/2010 | 79% | 70% | 57% | 27% |
| 5/30/2010 | 76% | 74% | 62% | 30% |
| 9/13/2010 | 78% | 68% | 56% | 27% |
| 11/24/2010 | 75% | 71% | 58% | 27% |
| 12/21/2010 | 71% | 71% | 63% | 33% |
| 5/22/2011 | 72% | 72% | 57% | 28% |
| 8/26/2011 | 76% | 70% | 60% | 30% |
| 2/19/2012 | 72% | 74% | 65% | 35% |
| 4/3/2012 | 75% | 77% | 62% | 39% |
| 11/10/2012 | 76% | 78% | 66% | 41% |
| 12/9/2012 | 75% | 74% | 62% | 41% |
| 5/19/2013 | 80% | 78% | 69% | 43% |
| 9/30/2013 | 81% | 77% | 68% | 47% |
| 4/12/2015 | 75% | 73% | 66% | 40% |
| 7/12/2015 | 75% | 76% | 62% | 48% |
| 11/15/2015 | 75% | 74% | 67% | 47% |
| 4/4/2016 | 80% | 78% | 66% | 49% |
| 11/6/2016 | 77% | 81% | 75% | 51% |
| 1/10/2018 | 67% | 70% | 68% | 50% |
| 2/7/2019 | 77% | 77% | 79% | 59% |
| 2/8/2021 | 70% | 86% | 79% | 64% |
| 9/5/2023 | 78% | 87% | 81% | 70% |
| 6/10/2024 | 77% | 87% | 82% | 70% |
| 6/18/2025 | 71% | 87% | 79% | 70% |
| 6/18/2026 | 74% | 83% | 83% | 71% |
Source: Surveys of U.S. adults conducted 2000-2026.
PEW RESEARCH CENTER
Home broadband use by race and ethnicity
% of U.S. adults who say they subscribe to home broadband, by race and ethnicity
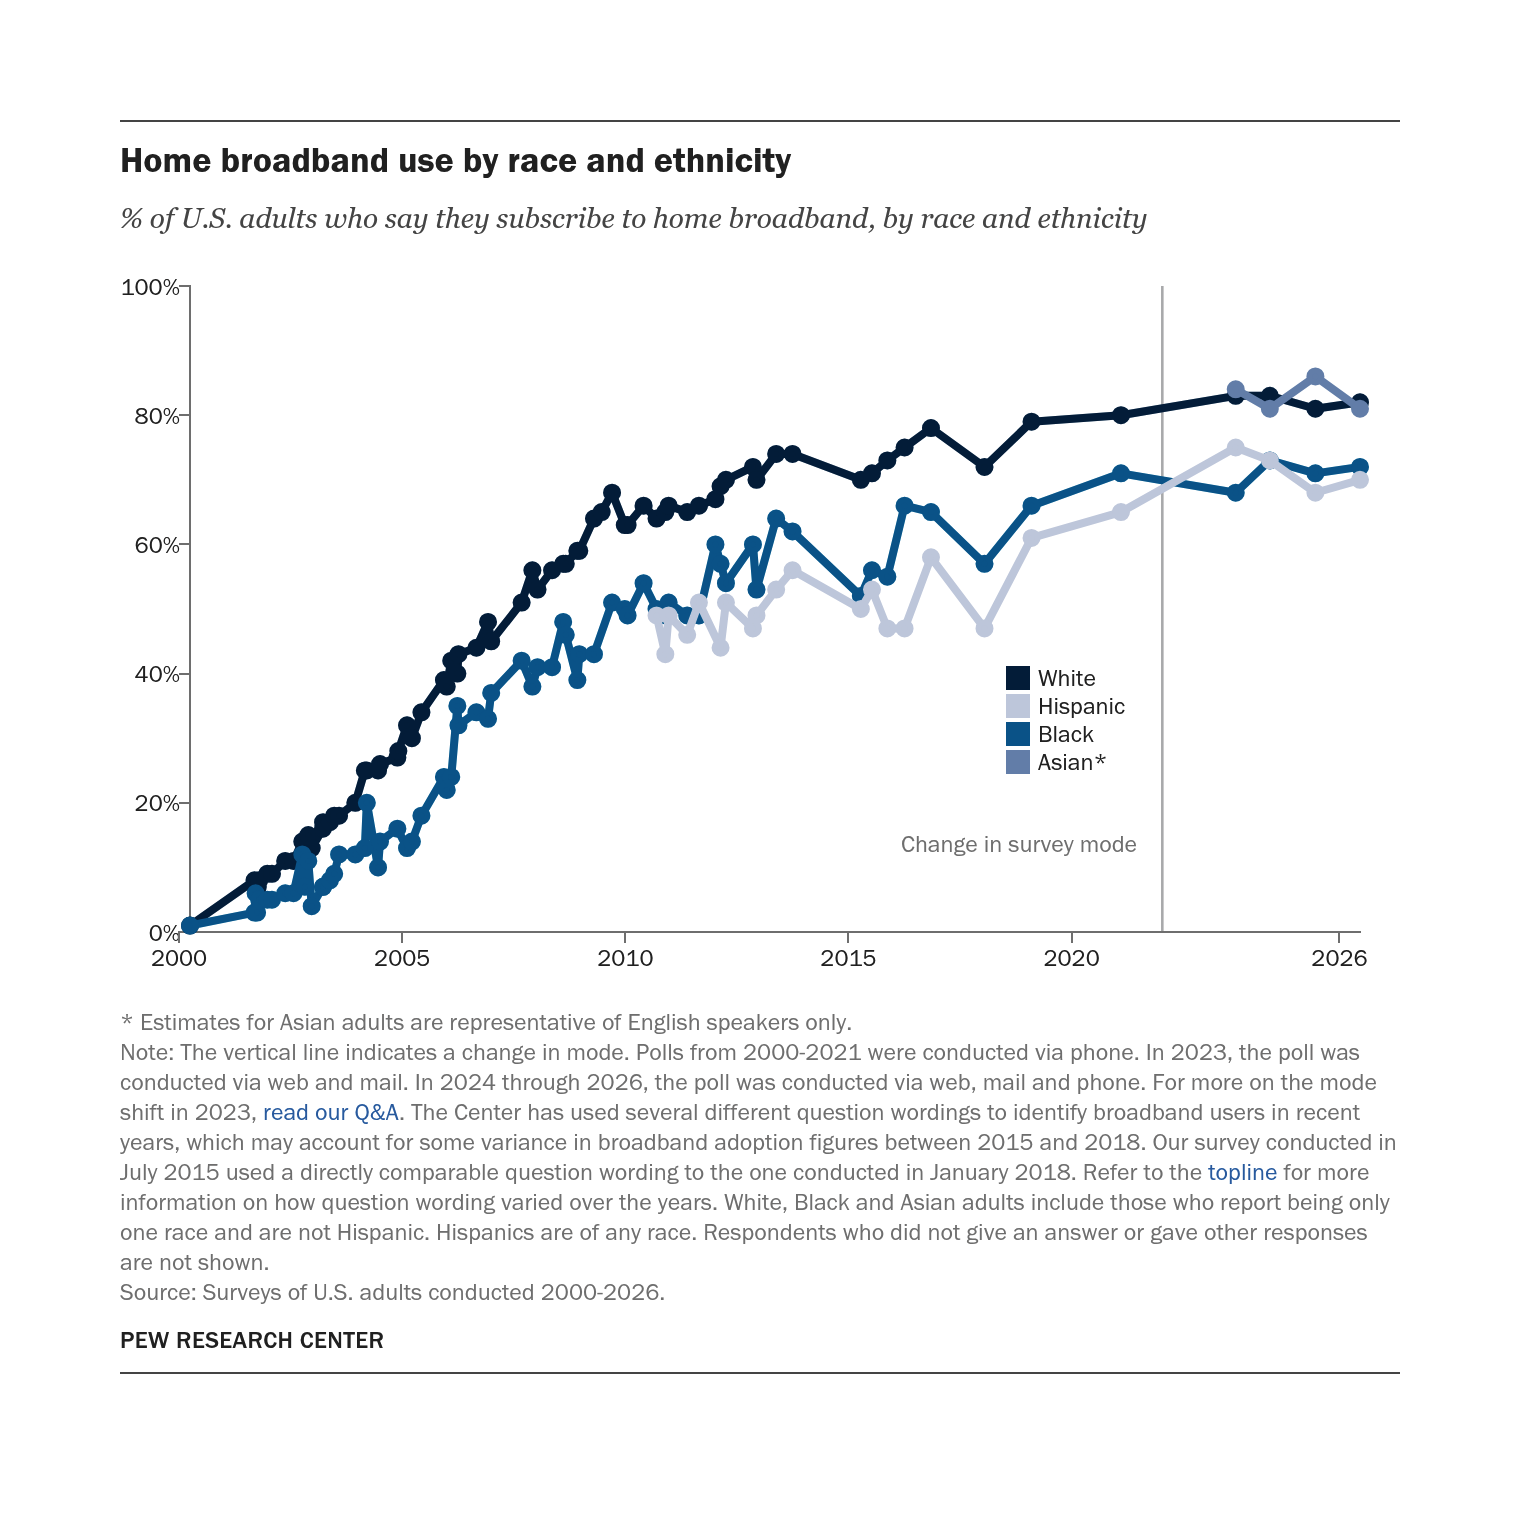
Note: The vertical line indicates a change in mode. Polls from 2000-2021 were conducted via phone. In 2023, the poll was conducted via web and mail. In 2024 through 2026, the poll was conducted via web, mail and phone. For more on the mode shift in 2023, read our Q&A. The Center has used several different question wordings to identify broadband users in recent years, which may account for some variance in broadband adoption figures between 2015 and 2018. Our survey conducted in July 2015 used a directly comparable question wording to the one conducted in January 2018. Refer to the topline for more information on how question wording varied over the years. White, Black and Asian adults include those who report being only one race and are not Hispanic. Hispanics are of any race. Respondents who did not give an answer or gave other responses are not shown.
Source: Surveys of U.S. adults conducted 2000-2026.
PEW RESEARCH CENTER
Home broadband use by race and ethnicity
% of U.S. adults who say they subscribe to home broadband, by race and ethnicity
| White | Hispanic | Black | Asian* | |
|---|---|---|---|---|
| 3/31/2000 | 1% | 1% | ||
| 9/10/2001 | 8% | 3% | ||
| 9/19/2001 | 7% | 6% | ||
| 10/1/2001 | 6% | 3% | ||
| 10/7/2001 | 7% | |||
| 10/18/2001 | 8% | 5% | ||
| 12/23/2001 | 9% | 5% | ||
| 1/31/2002 | 9% | 5% | ||
| 5/19/2002 | 11% | 6% | ||
| 7/26/2002 | 11% | 6% | ||
| 10/6/2002 | 14% | 12% | ||
| 10/27/2002 | 13% | 7% | ||
| 11/24/2002 | 15% | 11% | ||
| 12/22/2002 | 13% | 4% | ||
| 3/24/2003 | 16% | 7% | ||
| 3/25/2003 | 17% | 7% | ||
| 5/20/2003 | 17% | 8% | ||
| 6/24/2003 | 18% | 9% | ||
| 8/3/2003 | 18% | 12% | ||
| 12/14/2003 | 20% | 12% | ||
| 3/1/2004 | 25% | 13% | ||
| 3/17/2004 | 25% | 20% | ||
| 6/17/2004 | 25% | 10% | ||
| 7/3/2004 | 26% | 14% | ||
| 11/22/2004 | 27% | 16% | ||
| 11/30/2004 | 28% | |||
| 2/9/2005 | 32% | 13% | ||
| 3/21/2005 | 30% | 14% | ||
| 6/7/2005 | 34% | 18% | ||
| 12/8/2005 | 39% | 24% | ||
| 12/31/2005 | 38% | 22% | ||
| 2/6/2006 | 42% | 24% | ||
| 3/28/2006 | 40% | 35% | ||
| 4/6/2006 | 43% | 32% | ||
| 8/31/2006 | 44% | 34% | ||
| 12/4/2006 | 48% | 33% | ||
| 12/30/2006 | 45% | 37% | ||
| 9/5/2007 | 51% | 42% | ||
| 12/2/2007 | 56% | 38% | ||
| 1/13/2008 | 53% | 41% | ||
| 5/11/2008 | 56% | 41% | ||
| 8/10/2008 | 57% | 48% | ||
| 8/31/2008 | 57% | 46% | ||
| 12/4/2008 | 59% | 39% | ||
| 12/20/2008 | 59% | 43% | ||
| 4/19/2009 | 64% | 43% | ||
| 6/21/2009 | 65% | |||
| 9/14/2009 | 68% | 51% | ||
| 12/27/2009 | 63% | 50% | ||
| 1/19/2010 | 63% | 49% | ||
| 5/30/2010 | 66% | 54% | ||
| 9/13/2010 | 64% | 49% | 50% | |
| 11/24/2010 | 65% | 43% | 49% | |
| 12/21/2010 | 66% | 49% | 51% | |
| 5/22/2011 | 65% | 46% | 49% | |
| 8/26/2011 | 66% | 51% | 49% | |
| 1/8/2012 | 67% | 60% | ||
| 2/19/2012 | 69% | 44% | 57% | |
| 4/3/2012 | 70% | 51% | 54% | |
| 11/10/2012 | 72% | 47% | 60% | |
| 12/9/2012 | 70% | 49% | 53% | |
| 5/19/2013 | 74% | 53% | 64% | |
| 9/30/2013 | 74% | 56% | 62% | |
| 4/12/2015 | 70% | 50% | 52% | |
| 7/12/2015 | 71% | 53% | 56% | |
| 11/15/2015 | 73% | 47% | 55% | |
| 4/4/2016 | 75% | 47% | 66% | |
| 11/6/2016 | 78% | 58% | 65% | |
| 1/18/2018 | 72% | 47% | 57% | |
| 2/7/2019 | 79% | 61% | 66% | |
| 2/8/2021 | 80% | 65% | 71% | |
| 9/5/2023 | 83% | 75% | 68% | 84% |
| 6/10/2024 | 83% | 73% | 73% | 81% |
| 6/18/2025 | 81% | 68% | 71% | 86% |
| 6/18/2026 | 82% | 70% | 72% | 81% |
Note: The vertical line indicates a change in mode. Polls from 2000-2021 were conducted via phone. In 2023, the poll was conducted via web and mail. In 2024 through 2026, the poll was conducted via web, mail and phone. For more on the mode shift in 2023, read our Q&A. The Center has used several different question wordings to identify broadband users in recent years, which may account for some variance in broadband adoption figures between 2015 and 2018. Our survey conducted in July 2015 used a directly comparable question wording to the one conducted in January 2018. Refer to the topline for more information on how question wording varied over the years. White, Black and Asian adults include those who report being only one race and are not Hispanic. Hispanics are of any race. Respondents who did not give an answer or gave other responses are not shown.
Source: Surveys of U.S. adults conducted 2000-2026.
PEW RESEARCH CENTER
Home broadband use by gender
% of U.S. adults who say they subscribe to home broadband, by gender
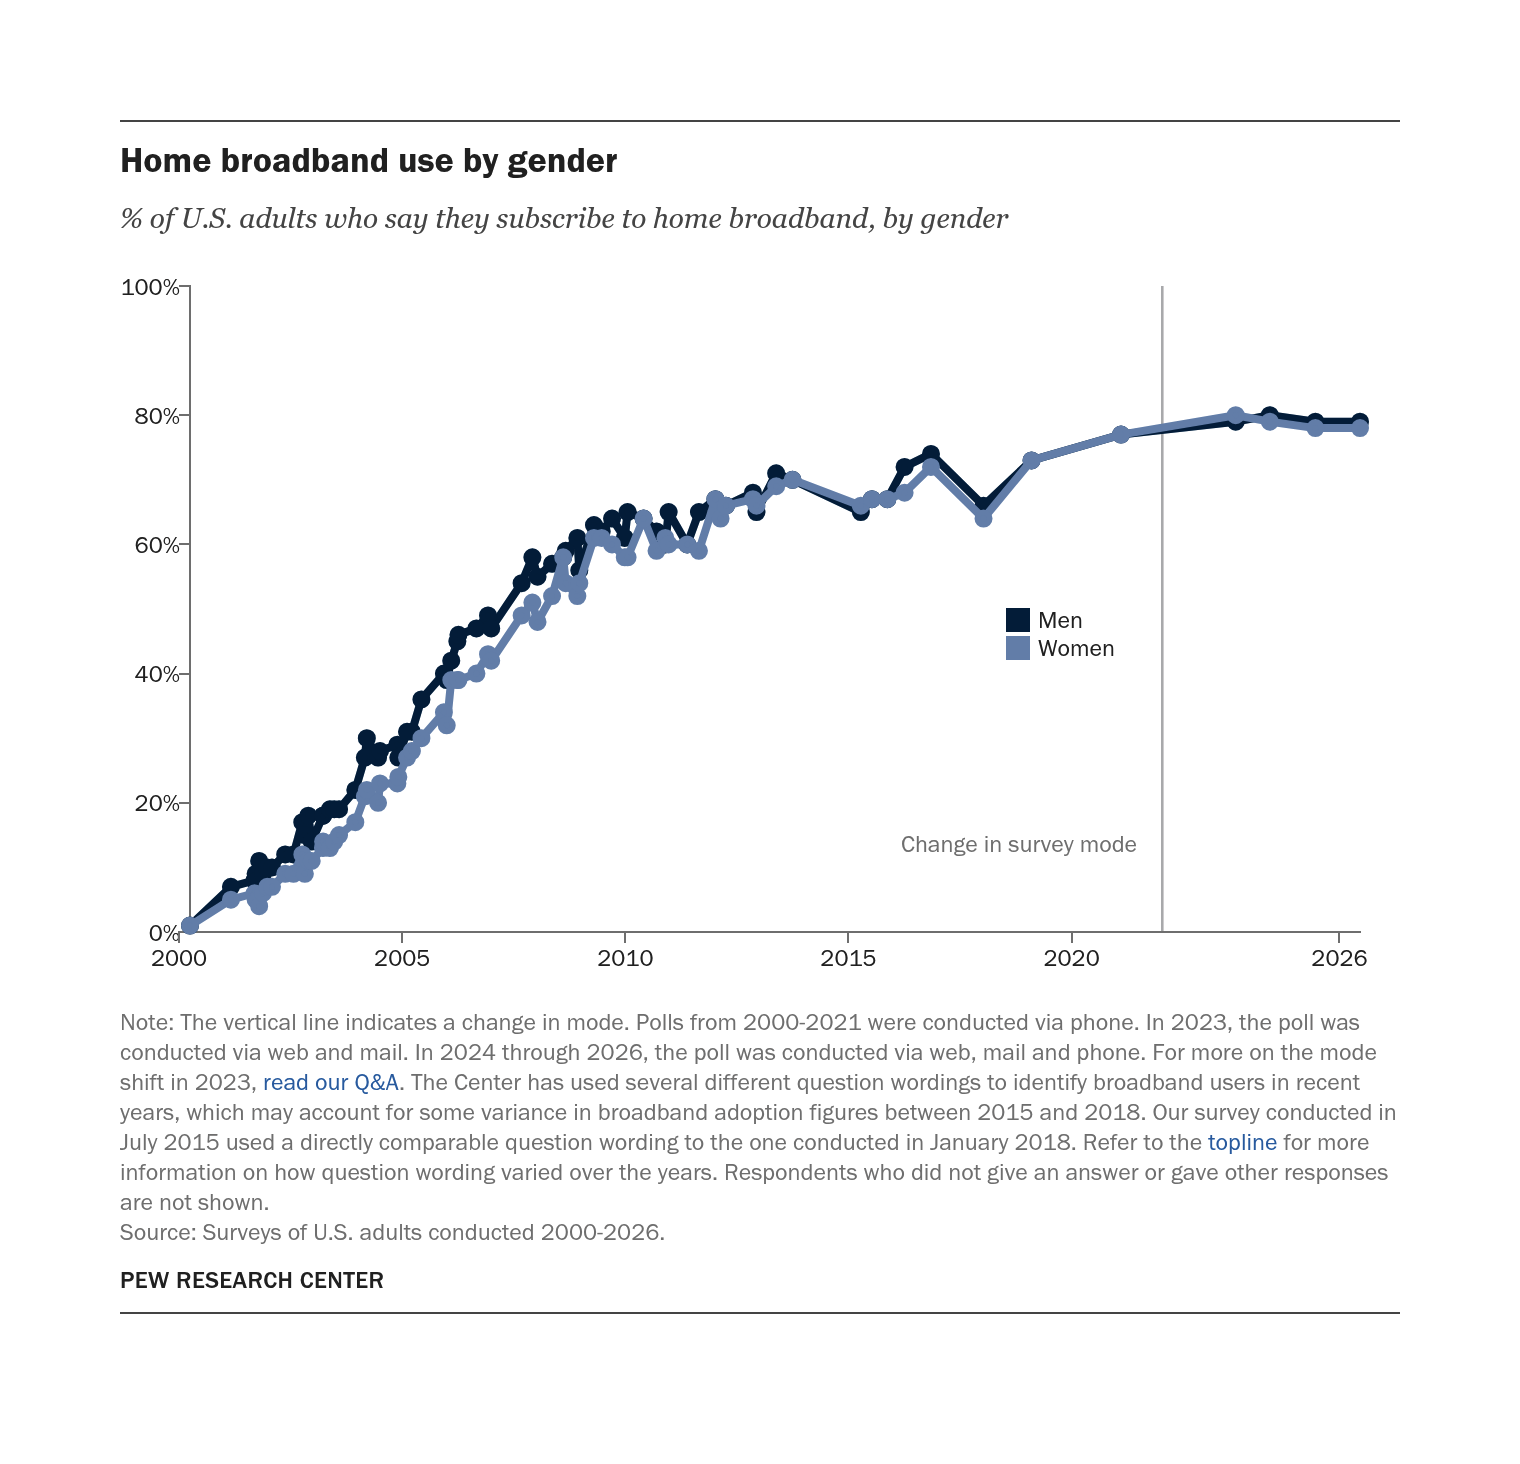
Source: Surveys of U.S. adults conducted 2000-2026.
PEW RESEARCH CENTER
Home broadband use by gender
% of U.S. adults who say they subscribe to home broadband, by gender
| Men | Women | |
|---|---|---|
| 3/31/2000 | 1% | 1% |
| 3/1/2001 | 7% | 5% |
| 9/10/2001 | 8% | 6% |
| 9/19/2001 | 9% | 5% |
| 10/1/2001 | 7% | 5% |
| 10/7/2001 | 8% | 5% |
| 10/18/2001 | 11% | 4% |
| 11/18/2001 | 9% | 6% |
| 12/23/2001 | 10% | 7% |
| 1/31/2002 | 10% | 7% |
| 5/19/2002 | 12% | 9% |
| 7/26/2002 | 12% | 9% |
| 10/6/2002 | 17% | 12% |
| 10/27/2002 | 15% | 9% |
| 11/24/2002 | 18% | 11% |
| 12/22/2002 | 14% | 11% |
| 3/24/2003 | 18% | 13% |
| 3/25/2003 | 18% | 14% |
| 5/20/2003 | 19% | 13% |
| 6/24/2003 | 19% | 14% |
| 8/3/2003 | 19% | 15% |
| 12/14/2003 | 22% | 17% |
| 3/1/2004 | 27% | 21% |
| 3/17/2004 | 30% | 22% |
| 6/17/2004 | 27% | 20% |
| 7/3/2004 | 28% | 23% |
| 11/22/2004 | 29% | 23% |
| 11/30/2004 | 27% | 24% |
| 2/9/2005 | 31% | 27% |
| 3/21/2005 | 31% | 28% |
| 6/7/2005 | 36% | 30% |
| 12/8/2005 | 40% | 34% |
| 12/31/2005 | 39% | 32% |
| 2/6/2006 | 42% | 39% |
| 3/28/2006 | 45% | 39% |
| 4/6/2006 | 46% | 39% |
| 8/31/2006 | 47% | 40% |
| 12/4/2006 | 49% | 43% |
| 12/30/2006 | 47% | 42% |
| 9/5/2007 | 54% | 49% |
| 12/2/2007 | 58% | 51% |
| 1/13/2008 | 55% | 48% |
| 5/11/2008 | 57% | 52% |
| 8/10/2008 | 58% | 58% |
| 8/31/2008 | 59% | 54% |
| 12/4/2008 | 61% | 52% |
| 12/20/2008 | 56% | 54% |
| 4/19/2009 | 63% | 61% |
| 6/21/2009 | 62% | 61% |
| 9/14/2009 | 64% | 60% |
| 12/27/2009 | 61% | 58% |
| 1/19/2010 | 65% | 58% |
| 5/30/2010 | 64% | 64% |
| 9/13/2010 | 62% | 59% |
| 11/24/2010 | 60% | 61% |
| 12/21/2010 | 65% | 60% |
| 5/22/2011 | 60% | 60% |
| 8/26/2011 | 65% | 59% |
| 1/8/2012 | 67% | 67% |
| 2/19/2012 | 66% | 64% |
| 4/3/2012 | 66% | 66% |
| 11/10/2012 | 68% | 67% |
| 12/9/2012 | 65% | 66% |
| 5/19/2013 | 71% | 69% |
| 9/30/2013 | 70% | 70% |
| 4/12/2015 | 65% | 66% |
| 7/12/2015 | 67% | 67% |
| 11/15/2015 | 67% | 67% |
| 4/4/2016 | 72% | 68% |
| 11/6/2016 | 74% | 72% |
| 1/10/2018 | 66% | 64% |
| 2/7/2019 | 73% | 73% |
| 2/8/2021 | 77% | 77% |
| 9/5/2023 | 79% | 80% |
| 6/10/2024 | 80% | 79% |
| 6/18/2025 | 79% | 78% |
| 6/18/2026 | 79% | 78% |
Source: Surveys of U.S. adults conducted 2000-2026.
PEW RESEARCH CENTER
Home broadband use by income
% of U.S. adults who say they subscribe to home broadband, by annual household income
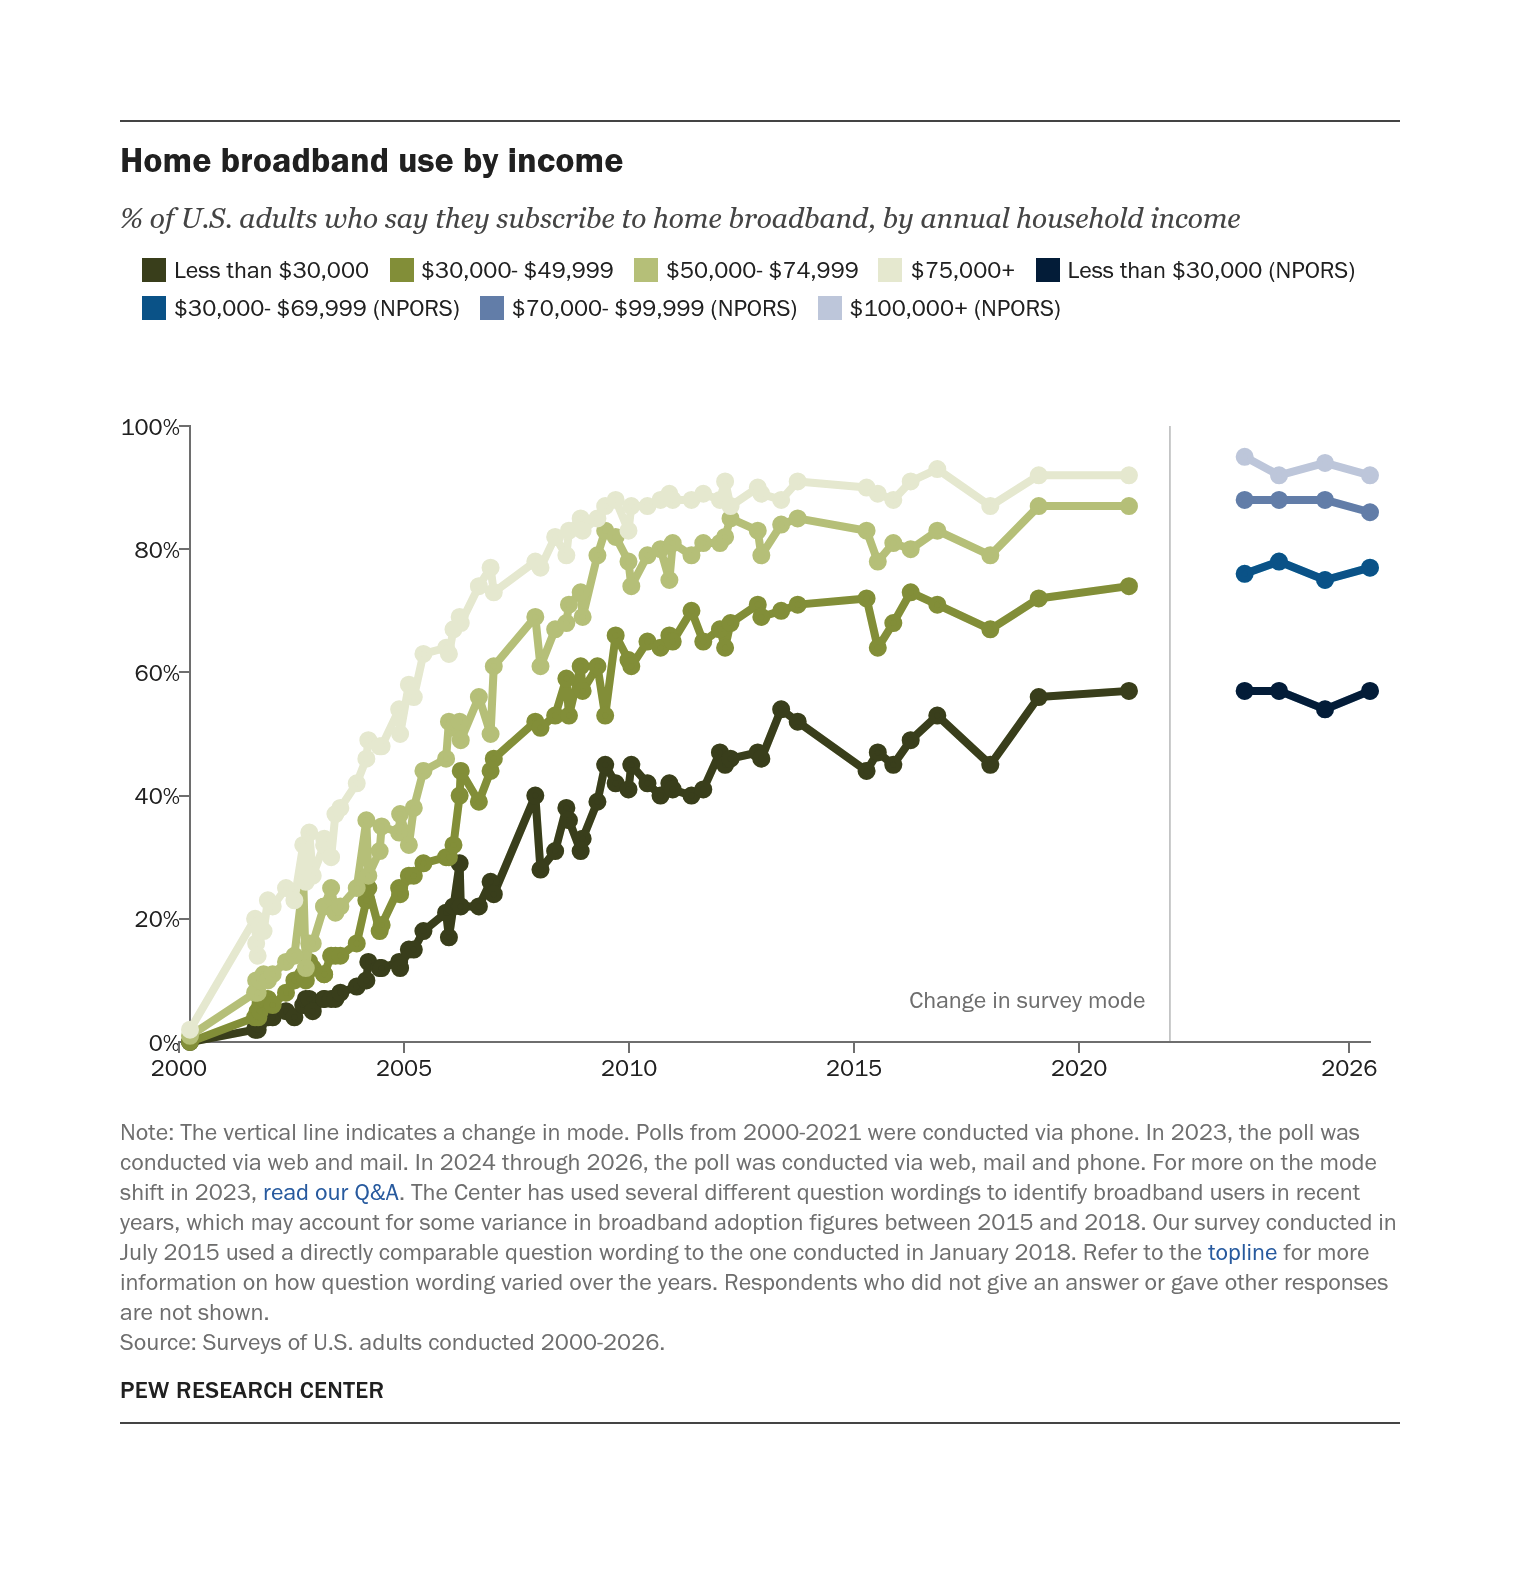
Source: Surveys of U.S. adults conducted 2000-2026.
PEW RESEARCH CENTER
Home broadband use by income
% of U.S. adults who say they subscribe to home broadband, by annual household income
| Less than $30,000 | $30,000- $49,999 | $50,000- $74,999 | $75,000+ | Less than $30,000 (NPORS) | $30,000- $69,999 (NPORS) | $70,000- $99,999 (NPORS) | $100,000+ (NPORS) | |
|---|---|---|---|---|---|---|---|---|
| 3/31/2000 | 0% | 0% | 1% | 2% | ||||
| 9/10/2001 | 2% | 4% | 8% | 20% | ||||
| 9/19/2001 | 3% | 8% | 10% | 16% | ||||
| 10/1/2001 | 2% | 5% | 8% | 14% | ||||
| 10/7/2001 | 3% | 4% | ||||||
| 10/18/2001 | 4% | 5% | 10% | 19% | ||||
| 11/18/2001 | 4% | 7% | 11% | 18% | ||||
| 12/23/2001 | 4% | 7% | 10% | 23% | ||||
| 1/31/2002 | 4% | 6% | 11% | 22% | ||||
| 5/19/2002 | 5% | 8% | 13% | 25% | ||||
| 7/26/2002 | 4% | 10% | 14% | 23% | ||||
| 10/6/2002 | 6% | 11% | 26% | 32% | ||||
| 10/27/2002 | 7% | 10% | 12% | 26% | ||||
| 11/24/2002 | 7% | 13% | 16% | 34% | ||||
| 12/22/2002 | 5% | 12% | 16% | 27% | ||||
| 3/24/2003 | 7% | 11% | 22% | 32% | ||||
| 3/25/2003 | 7% | 11% | 22% | 33% | ||||
| 5/20/2003 | 7% | 14% | 25% | 30% | ||||
| 6/24/2003 | 7% | 14% | 21% | 37% | ||||
| 8/3/2003 | 8% | 14% | 22% | 38% | ||||
| 12/14/2003 | 9% | 16% | 25% | 42% | ||||
| 3/1/2004 | 10% | 23% | 36% | 46% | ||||
| 3/17/2004 | 13% | 25% | 27% | 49% | ||||
| 6/17/2004 | 12% | 18% | 31% | 48% | ||||
| 7/3/2004 | 12% | 19% | 35% | 48% | ||||
| 11/22/2004 | 13% | 25% | 34% | 54% | ||||
| 11/30/2004 | 12% | 24% | 37% | 50% | ||||
| 2/9/2005 | 15% | 27% | 32% | 58% | ||||
| 3/21/2005 | 15% | 27% | 38% | 56% | ||||
| 6/7/2005 | 18% | 29% | 44% | 63% | ||||
| 12/8/2005 | 21% | 30% | 46% | 64% | ||||
| 12/31/2005 | 17% | 30% | 52% | 63% | ||||
| 2/6/2006 | 22% | 32% | 51% | 67% | ||||
| 3/28/2006 | 29% | 40% | 52% | 69% | ||||
| 4/6/2006 | 22% | 44% | 49% | 68% | ||||
| 8/31/2006 | 22% | 39% | 56% | 74% | ||||
| 12/4/2006 | 26% | 44% | 50% | 77% | ||||
| 12/30/2006 | 24% | 46% | 61% | 73% | ||||
| 12/2/2007 | 40% | 52% | 69% | 78% | ||||
| 1/13/2008 | 28% | 51% | 61% | 77% | ||||
| 5/11/2008 | 31% | 53% | 67% | 82% | ||||
| 8/10/2008 | 38% | 59% | 68% | 79% | ||||
| 8/31/2008 | 36% | 53% | 71% | 83% | ||||
| 12/4/2008 | 31% | 61% | 73% | 85% | ||||
| 12/20/2008 | 33% | 57% | 69% | 83% | ||||
| 4/19/2009 | 39% | 61% | 79% | 85% | ||||
| 6/21/2009 | 45% | 53% | 83% | 87% | ||||
| 9/14/2009 | 42% | 66% | 82% | 88% | ||||
| 12/27/2009 | 41% | 62% | 78% | 83% | ||||
| 1/19/2010 | 45% | 61% | 74% | 87% | ||||
| 5/30/2010 | 42% | 65% | 79% | 87% | ||||
| 9/13/2010 | 40% | 64% | 80% | 88% | ||||
| 11/24/2010 | 42% | 66% | 75% | 89% | ||||
| 12/21/2010 | 41% | 65% | 81% | 88% | ||||
| 5/22/2011 | 40% | 70% | 79% | 88% | ||||
| 8/26/2011 | 41% | 65% | 81% | 89% | ||||
| 1/8/2012 | 47% | 67% | 81% | 88% | ||||
| 2/19/2012 | 45% | 64% | 82% | 91% | ||||
| 4/3/2012 | 46% | 68% | 85% | 87% | ||||
| 11/10/2012 | 47% | 71% | 83% | 90% | ||||
| 12/9/2012 | 46% | 69% | 79% | 89% | ||||
| 5/19/2013 | 54% | 70% | 84% | 88% | ||||
| 9/30/2013 | 52% | 71% | 85% | 91% | ||||
| 4/12/2015 | 44% | 72% | 83% | 90% | ||||
| 7/12/2015 | 47% | 64% | 78% | 89% | ||||
| 11/15/2015 | 45% | 68% | 81% | 88% | ||||
| 4/4/2016 | 49% | 73% | 80% | 91% | ||||
| 11/6/2016 | 53% | 71% | 83% | 93% | ||||
| 1/10/2018 | 45% | 67% | 79% | 87% | ||||
| 2/7/2019 | 56% | 72% | 87% | 92% | ||||
| 2/8/2021 | 57% | 74% | 87% | 92% | ||||
| 9/5/2023 | 57% | 76% | 88% | 95% | ||||
| 6/10/2024 | 57% | 78% | 88% | 92% | ||||
| 6/18/2025 | 54% | 75% | 88% | 94% | ||||
| 6/18/2026 | 57% | 77% | 86% | 92% |
Source: Surveys of U.S. adults conducted 2000-2026.
PEW RESEARCH CENTER
Home broadband use by education
% of U.S. adults who say they subscribe to home broadband, by education level
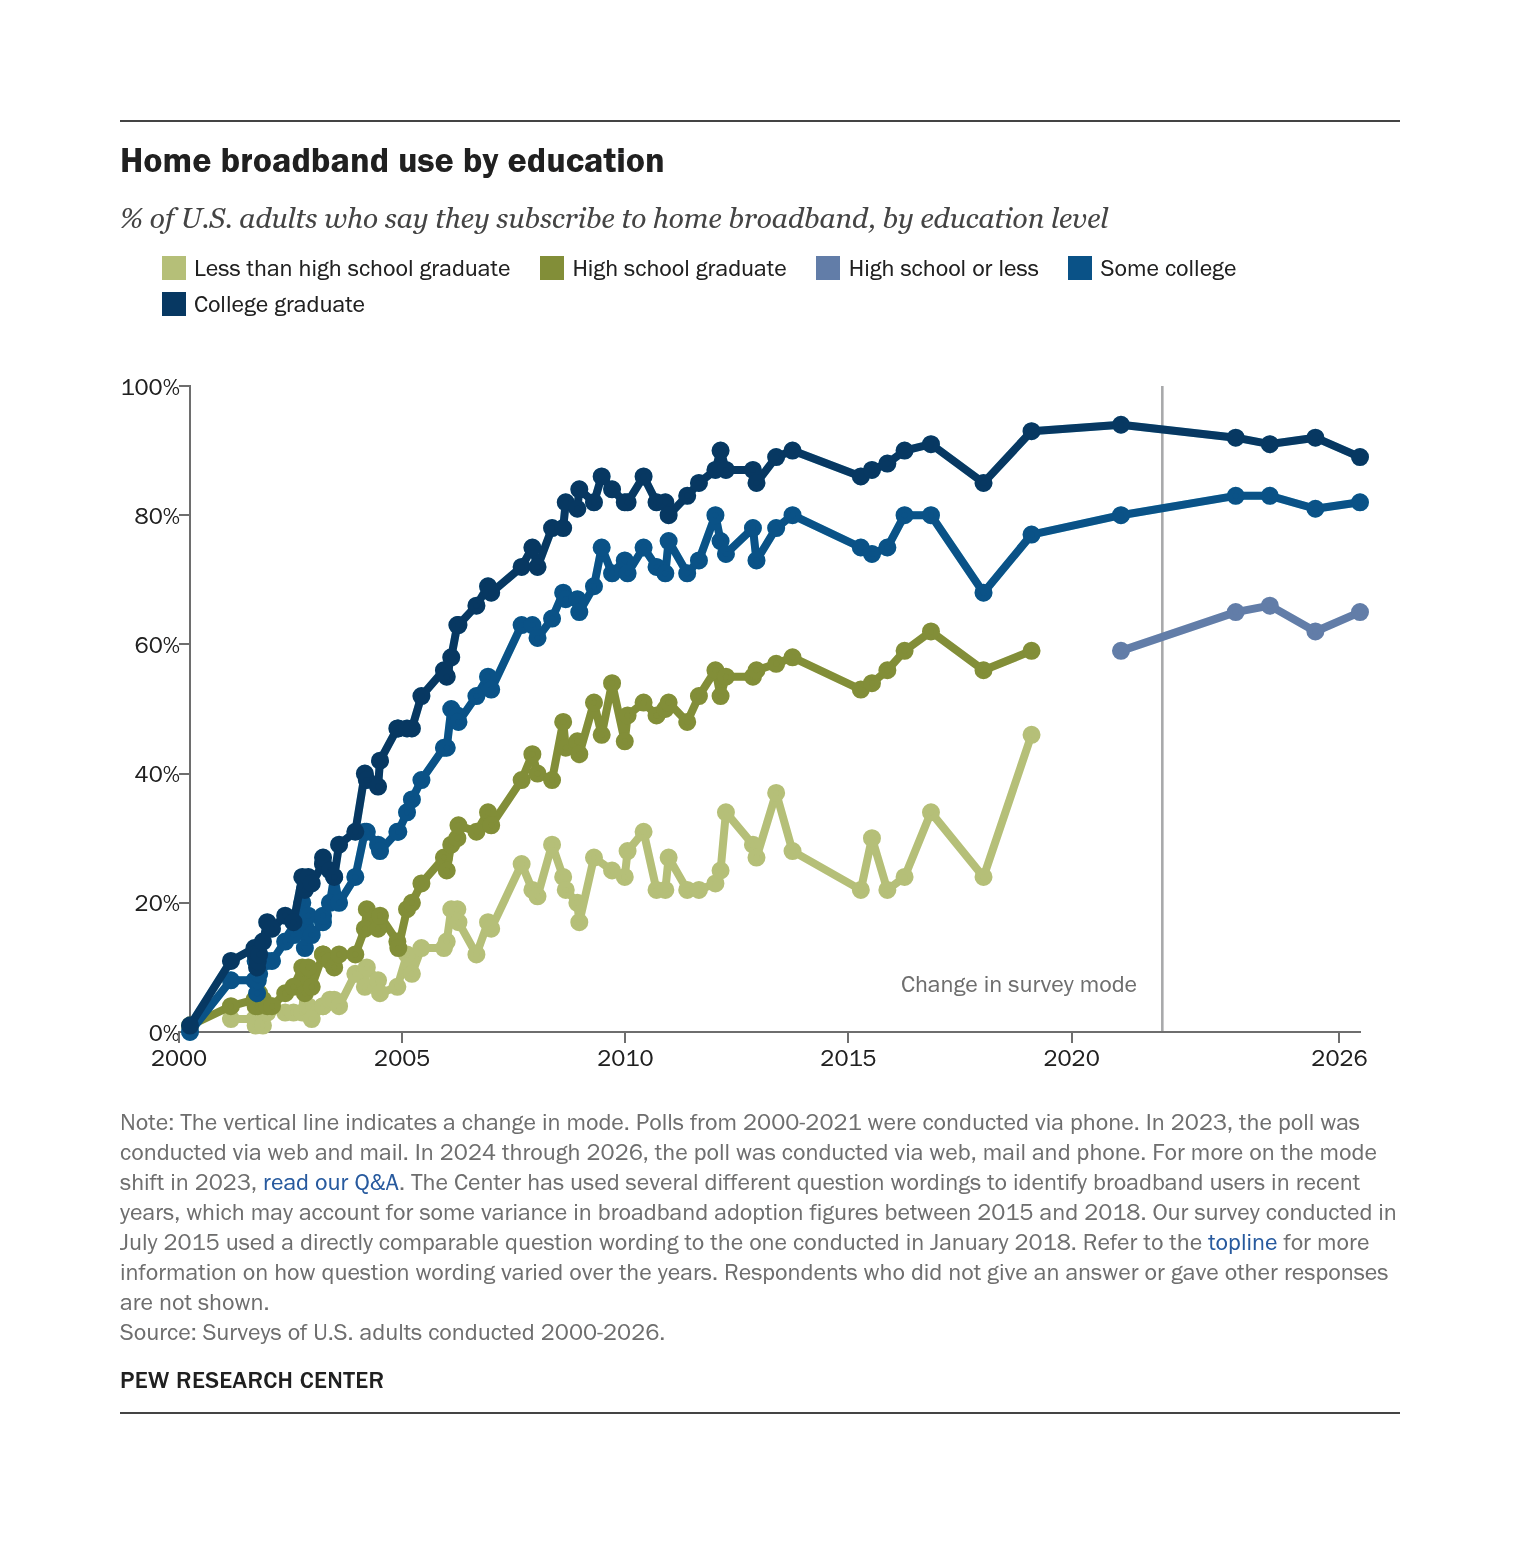
Source: Surveys of U.S. adults conducted 2000-2026.
PEW RESEARCH CENTER
Home broadband use by education
% of U.S. adults who say they subscribe to home broadband, by education level
| Less than high school graduate | High school graduate | High school or less | Some college | College graduate | |
|---|---|---|---|---|---|
| 3/31/2000 | 1% | 0% | 1% | ||
| 3/1/2001 | 2% | 4% | 8% | 11% | |
| 9/10/2001 | 2% | 5% | 8% | 13% | |
| 9/19/2001 | 1% | 4% | 11% | 12% | |
| 10/1/2001 | 5% | 6% | 10% | ||
| 10/7/2001 | 4% | 8% | 11% | ||
| 10/18/2001 | 3% | 6% | 9% | 12% | |
| 11/18/2001 | 1% | 5% | 11% | 14% | |
| 12/23/2001 | 3% | 4% | 11% | 17% | |
| 1/31/2002 | 4% | 4% | 11% | 16% | |
| 5/19/2002 | 3% | 6% | 14% | 18% | |
| 7/26/2002 | 3% | 7% | 15% | 17% | |
| 10/6/2002 | 3% | 10% | 20% | 24% | |
| 10/27/2002 | 9% | 6% | 13% | 22% | |
| 11/24/2002 | 4% | 10% | 18% | 24% | |
| 12/22/2002 | 2% | 7% | 15% | 23% | |
| 3/24/2003 | 4% | 12% | 17% | 26% | |
| 3/25/2003 | 4% | 12% | 18% | 27% | |
| 5/20/2003 | 5% | 11% | 20% | 25% | |
| 6/24/2003 | 5% | 10% | 24% | 24% | |
| 8/3/2003 | 4% | 12% | 20% | 29% | |
| 12/14/2003 | 9% | 12% | 24% | 31% | |
| 3/1/2004 | 7% | 16% | 31% | 40% | |
| 3/17/2004 | 10% | 19% | 31% | 39% | |
| 6/17/2004 | 8% | 16% | 29% | 38% | |
| 7/3/2004 | 6% | 18% | 28% | 42% | |
| 11/22/2004 | 7% | 14% | 31% | 47% | |
| 11/30/2004 | 13% | 31% | 47% | ||
| 2/9/2005 | 12% | 19% | 34% | 47% | |
| 3/21/2005 | 9% | 20% | 36% | 47% | |
| 6/7/2005 | 13% | 23% | 39% | 52% | |
| 12/8/2005 | 13% | 27% | 44% | 56% | |
| 12/31/2005 | 14% | 25% | 44% | 55% | |
| 2/6/2006 | 19% | 29% | 50% | 58% | |
| 3/28/2006 | 19% | 30% | 49% | 63% | |
| 4/6/2006 | 17% | 32% | 48% | 63% | |
| 8/31/2006 | 12% | 31% | 52% | 66% | |
| 12/4/2006 | 17% | 34% | 55% | 69% | |
| 12/30/2006 | 16% | 32% | 53% | 68% | |
| 9/5/2007 | 26% | 39% | 63% | 72% | |
| 12/2/2007 | 22% | 43% | 63% | 75% | |
| 1/13/2008 | 21% | 40% | 61% | 72% | |
| 5/11/2008 | 29% | 39% | 64% | 78% | |
| 8/10/2008 | 24% | 48% | 68% | 78% | |
| 8/31/2008 | 22% | 44% | 67% | 82% | |
| 12/4/2008 | 20% | 45% | 67% | 81% | |
| 12/20/2008 | 17% | 43% | 65% | 84% | |
| 4/19/2009 | 27% | 51% | 69% | 82% | |
| 6/21/2009 | 46% | 75% | 86% | ||
| 9/14/2009 | 25% | 54% | 71% | 84% | |
| 12/27/2009 | 24% | 45% | 73% | 82% | |
| 1/19/2010 | 28% | 49% | 71% | 82% | |
| 5/30/2010 | 31% | 51% | 75% | 86% | |
| 9/13/2010 | 22% | 49% | 72% | 82% | |
| 11/24/2010 | 22% | 50% | 71% | 82% | |
| 12/21/2010 | 27% | 51% | 76% | 80% | |
| 5/22/2011 | 22% | 48% | 71% | 83% | |
| 8/26/2011 | 22% | 52% | 73% | 85% | |
| 1/8/2012 | 23% | 56% | 80% | 87% | |
| 2/19/2012 | 25% | 52% | 76% | 90% | |
| 4/3/2012 | 34% | 55% | 74% | 87% | |
| 11/10/2012 | 29% | 55% | 78% | 87% | |
| 12/9/2012 | 27% | 56% | 73% | 85% | |
| 5/19/2013 | 37% | 57% | 78% | 89% | |
| 9/30/2013 | 28% | 58% | 80% | 90% | |
| 4/12/2015 | 22% | 53% | 75% | 86% | |
| 7/12/2015 | 30% | 54% | 74% | 87% | |
| 11/15/2015 | 22% | 56% | 75% | 88% | |
| 4/4/2016 | 24% | 59% | 80% | 90% | |
| 11/6/2016 | 34% | 62% | 80% | 91% | |
| 1/10/2018 | 24% | 56% | 68% | 85% | |
| 2/7/2019 | 46% | 59% | 77% | 93% | |
| 2/8/2021 | 59% | 80% | 94% | ||
| 9/5/2023 | 65% | 83% | 92% | ||
| 6/10/2024 | 66% | 83% | 91% | ||
| 6/18/2025 | 62% | 81% | 92% | ||
| 6/18/2026 | 65% | 82% | 89% |
Source: Surveys of U.S. adults conducted 2000-2026.
PEW RESEARCH CENTER

Smartphone dependency over time
Today, 16% of U.S. adults are “smartphone-only” internet users, meaning they own a smartphone but do not subscribe to a home broadband service.
Smartphone dependency
% of U.S. adults who say they do not use broadband at home but own a smartphone
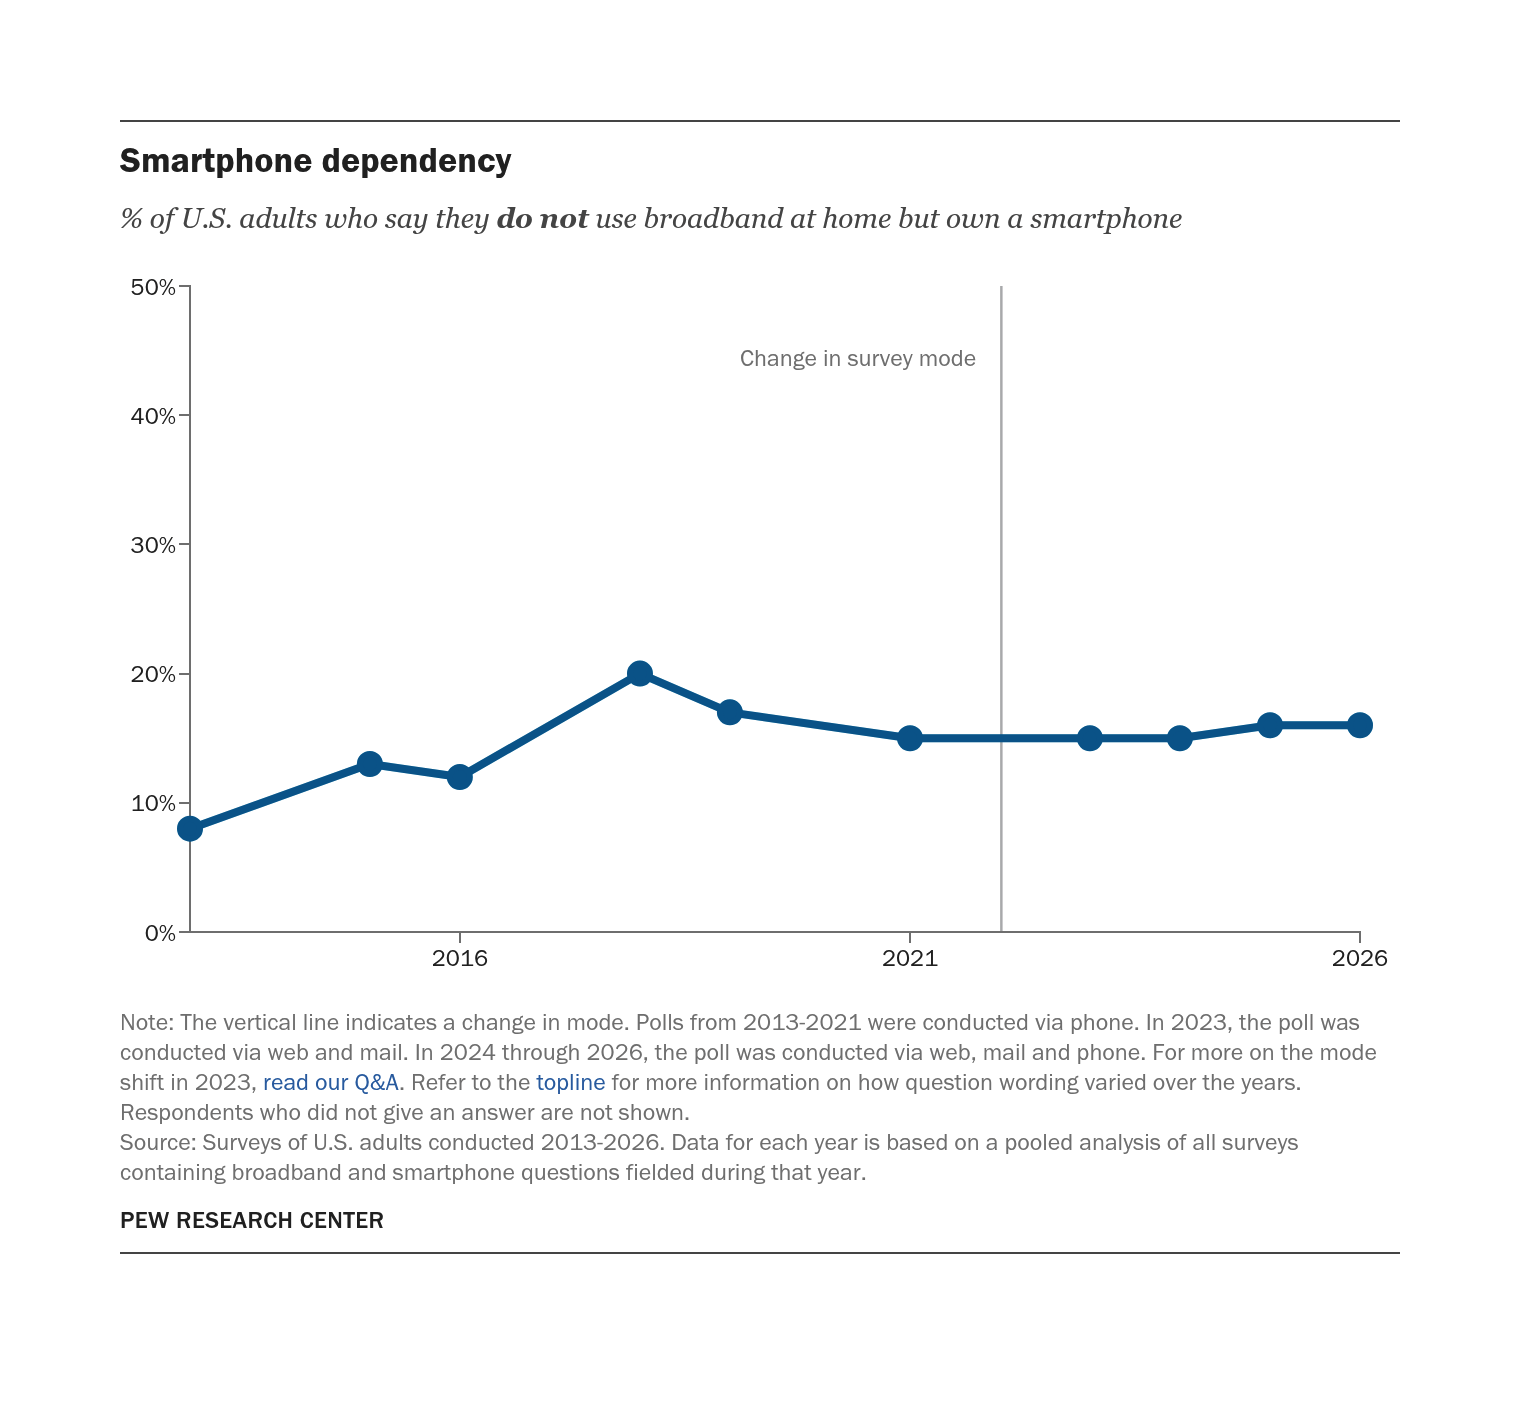
Source: Surveys of U.S. adults conducted 2013-2026. Data for each year is based on a pooled analysis of all surveys containing broadband and smartphone questions fielded during that year.
PEW RESEARCH CENTER
Smartphone dependency
% of U.S. adults who say they do not use broadband at home but own a smartphone
| U.S. adults | |
|---|---|
| 2013 | 8% |
| 2015 | 13% |
| 2016 | 12% |
| 2018 | 20% |
| 2019 | 17% |
| 2021 | 15% |
| 2023 | 15% |
| 2024 | 15% |
| 2025 | 16% |
| 2026 | 16% |
Source: Surveys of U.S. adults conducted 2013-2026. Data for each year is based on a pooled analysis of all surveys containing broadband and smartphone questions fielded during that year.
PEW RESEARCH CENTER
Who is smartphone dependent?
Reliance on smartphones for online access is especially common among Americans with lower household incomes and those with less formal education.
Tab Contents
Smartphone dependency by age
% of U.S. adults who are smartphone dependent, by age
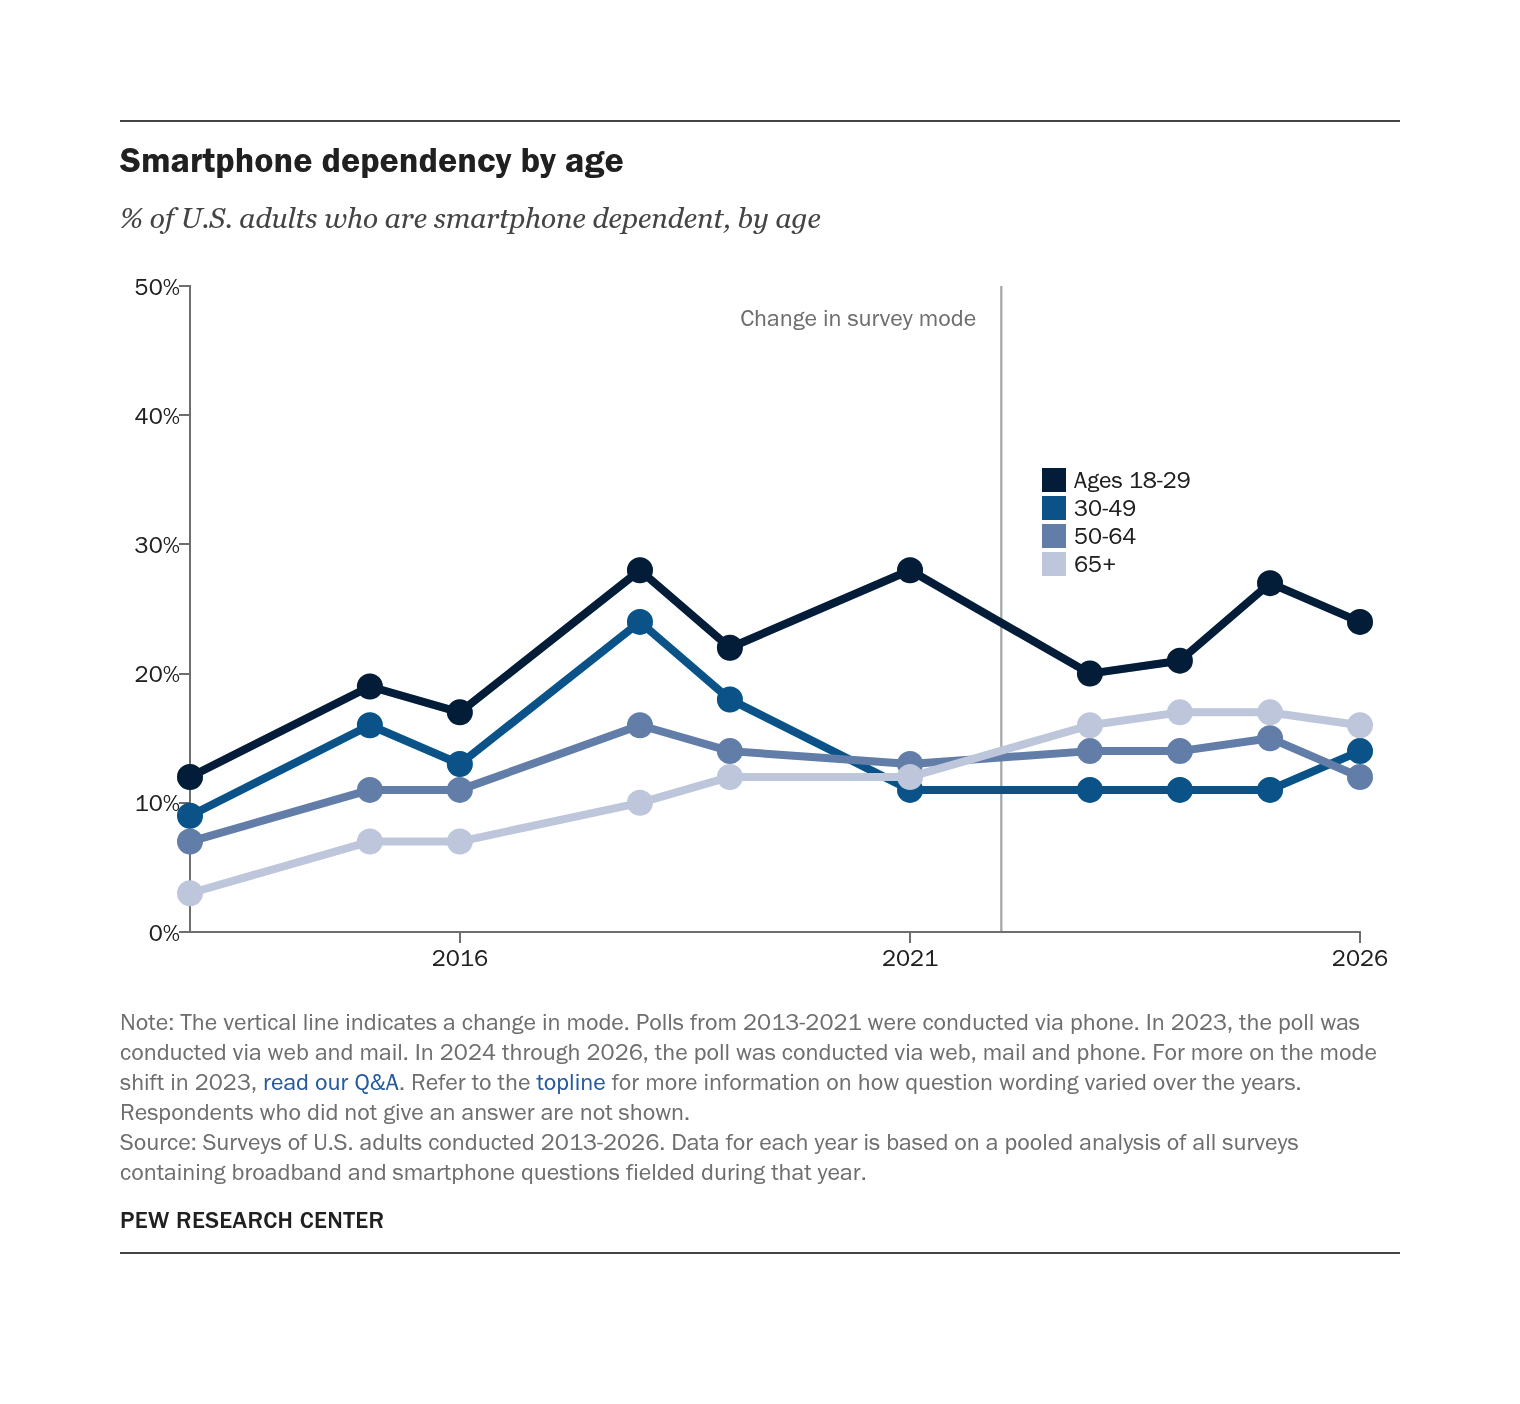
Source: Surveys of U.S. adults conducted 2013-2026. Data for each year is based on a pooled analysis of all surveys containing broadband and smartphone questions fielded during that year.
PEW RESEARCH CENTER
Smartphone dependency by age
% of U.S. adults who are smartphone dependent, by age
| Ages 18-29 | 30-49 | 50-64 | 65+ | |
|---|---|---|---|---|
| 2013 | 12% | 9% | 7% | 3% |
| 2015 | 19% | 16% | 11% | 7% |
| 2016 | 17% | 13% | 11% | 7% |
| 2018 | 28% | 24% | 16% | 10% |
| 2019 | 22% | 18% | 14% | 12% |
| 2021 | 28% | 11% | 13% | 12% |
| 2023 | 20% | 11% | 14% | 16% |
| 2024 | 21% | 11% | 14% | 17% |
| 2025 | 27% | 11% | 15% | 17% |
| 2026 | 24% | 14% | 12% | 16% |
Source: Surveys of U.S. adults conducted 2013-2026. Data for each year is based on a pooled analysis of all surveys containing broadband and smartphone questions fielded during that year.
PEW RESEARCH CENTER
Smartphone dependency by race and ethnicity
% of U.S. adults who are smartphone dependent, by race and ethnicity
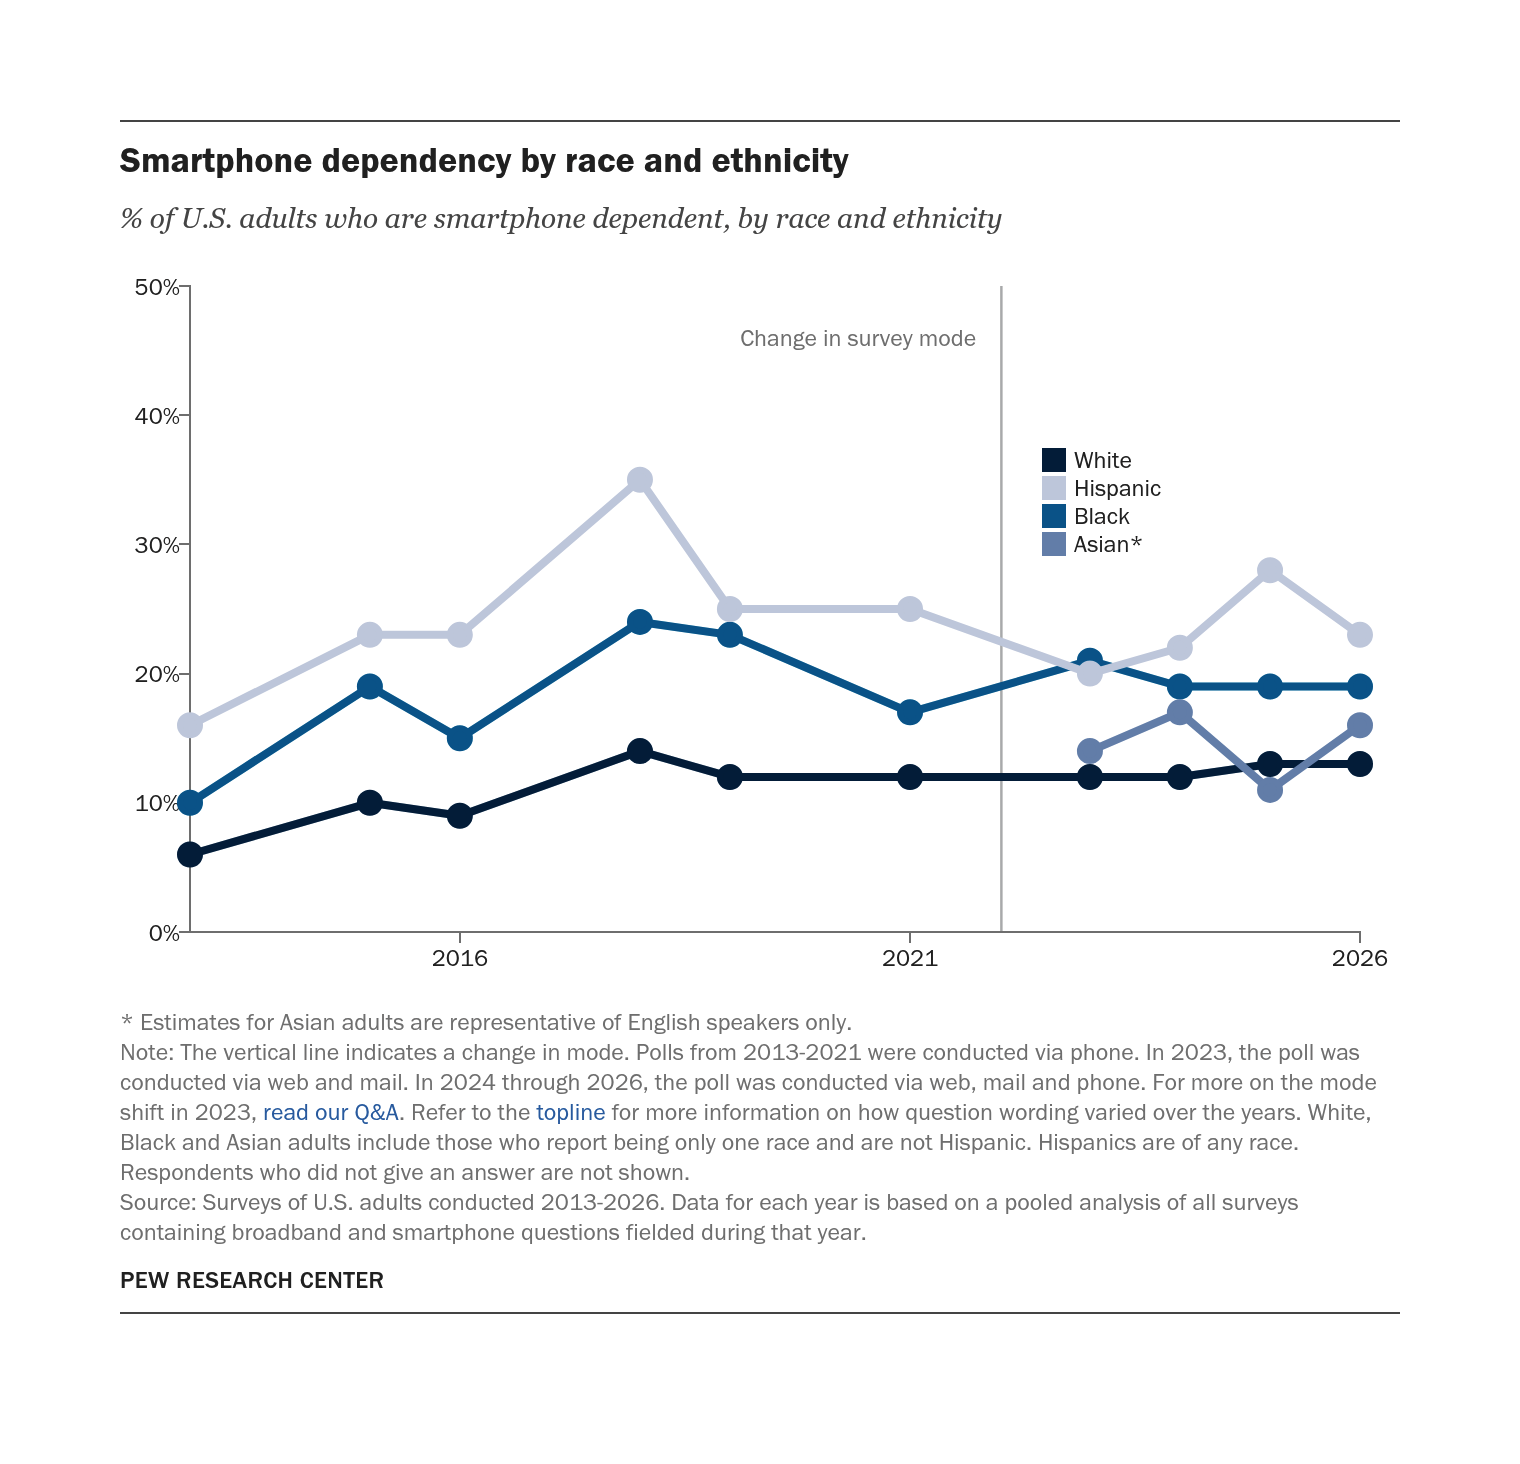
Note: The vertical line indicates a change in mode. Polls from 2013-2021 were conducted via phone. In 2023, the poll was conducted via web and mail. In 2024 through 2026, the poll was conducted via web, mail and phone. For more on the mode shift in 2023, read our Q&A. Refer to the topline for more information on how question wording varied over the years. White, Black and Asian adults include those who report being only one race and are not Hispanic. Hispanics are of any race. Respondents who did not give an answer are not shown.
Source: Surveys of U.S. adults conducted 2013-2026. Data for each year is based on a pooled analysis of all surveys containing broadband and smartphone questions fielded during that year.
PEW RESEARCH CENTER
Smartphone dependency by race and ethnicity
% of U.S. adults who are smartphone dependent, by race and ethnicity
| White | Hispanic | Black | Asian* | |
|---|---|---|---|---|
| 2013 | 6% | 16% | 10% | |
| 2015 | 10% | 23% | 19% | |
| 2016 | 9% | 23% | 15% | |
| 2018 | 14% | 35% | 24% | |
| 2019 | 12% | 25% | 23% | |
| 2021 | 12% | 25% | 17% | |
| 2023 | 12% | 20% | 21% | 14% |
| 2024 | 12% | 22% | 19% | 17% |
| 2025 | 13% | 28% | 19% | 11% |
| 2026 | 13% | 23% | 19% | 16% |
Note: The vertical line indicates a change in mode. Polls from 2013-2021 were conducted via phone. In 2023, the poll was conducted via web and mail. In 2024 through 2026, the poll was conducted via web, mail and phone. For more on the mode shift in 2023, read our Q&A. Refer to the topline for more information on how question wording varied over the years. White, Black and Asian adults include those who report being only one race and are not Hispanic. Hispanics are of any race. Respondents who did not give an answer are not shown.
Source: Surveys of U.S. adults conducted 2013-2026. Data for each year is based on a pooled analysis of all surveys containing broadband and smartphone questions fielded during that year.
PEW RESEARCH CENTER
Smartphone dependency by gender
% of U.S. adults who are smartphone dependent, by gender
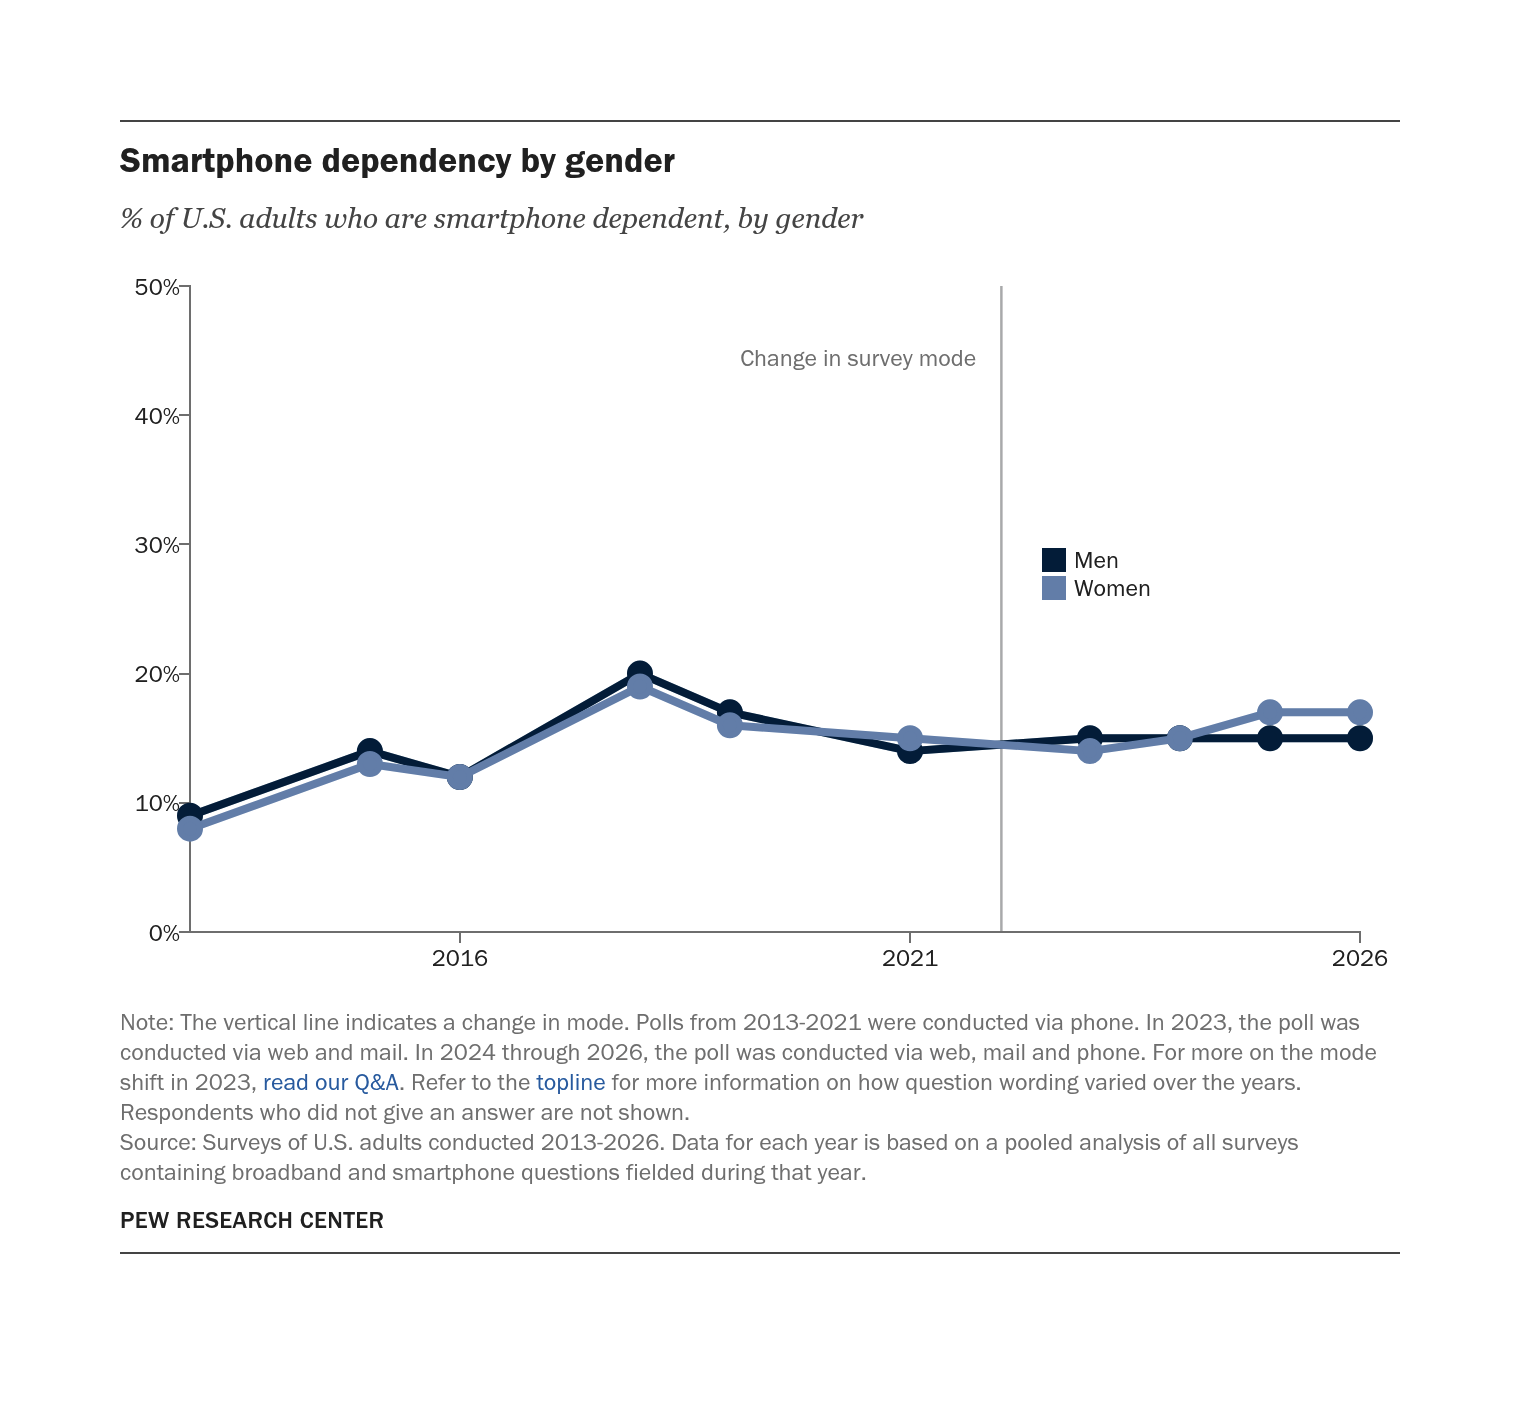
Source: Surveys of U.S. adults conducted 2013-2026. Data for each year is based on a pooled analysis of all surveys containing broadband and smartphone questions fielded during that year.
PEW RESEARCH CENTER
Smartphone dependency by gender
% of U.S. adults who are smartphone dependent, by gender
| Men | Women | |
|---|---|---|
| 2013 | 9% | 8% |
| 2015 | 14% | 13% |
| 2016 | 12% | 12% |
| 2018 | 20% | 19% |
| 2019 | 17% | 16% |
| 2021 | 14% | 15% |
| 2023 | 15% | 14% |
| 2024 | 15% | 15% |
| 2025 | 15% | 17% |
| 2026 | 15% | 17% |
Source: Surveys of U.S. adults conducted 2013-2026. Data for each year is based on a pooled analysis of all surveys containing broadband and smartphone questions fielded during that year.
PEW RESEARCH CENTER
Smartphone dependency by income
% of U.S. adults who are smartphone dependent, by annual household income
| Less than $30,000 | $30,000- $49,999 | $50,000- $74,999 | $75,000+ | Less than $30,000 (NPORS) | $30,000- $69,999 (NPORS) | $70,000- $99,999 (NPORS) | $100,000+ (NPORS) | |
|---|---|---|---|---|---|---|---|---|
| 2013 | 12% | 9% | 5% | 5% | ||||
| 2015 | 20% | 15% | 10% | 6% | ||||
| 2016 | 21% | 12% | 10% | 5% | ||||
| 2018 | 31% | 22% | 14% | 9% | ||||
| 2019 | 26% | 20% | 10% | 6% | ||||
| 2021 | 27% | 19% | 6% | 6% | ||||
| 2023 | 28% | 19% | 9% | 4% | ||||
| 2024 | 31% | 17% | 9% | 6% | ||||
| 2025 | 34% | 19% | 10% | 4% | ||||
| 2026 | 29% | 18% | 12% | 7% |
Source: Surveys of U.S. adults conducted 2013-2026. Data for each year is based on a pooled analysis of all surveys containing broadband and smartphone questions fielded during that year.
PEW RESEARCH CENTER
Smartphone dependency by education level
% of U.S. adults who are smartphone dependent, by education level
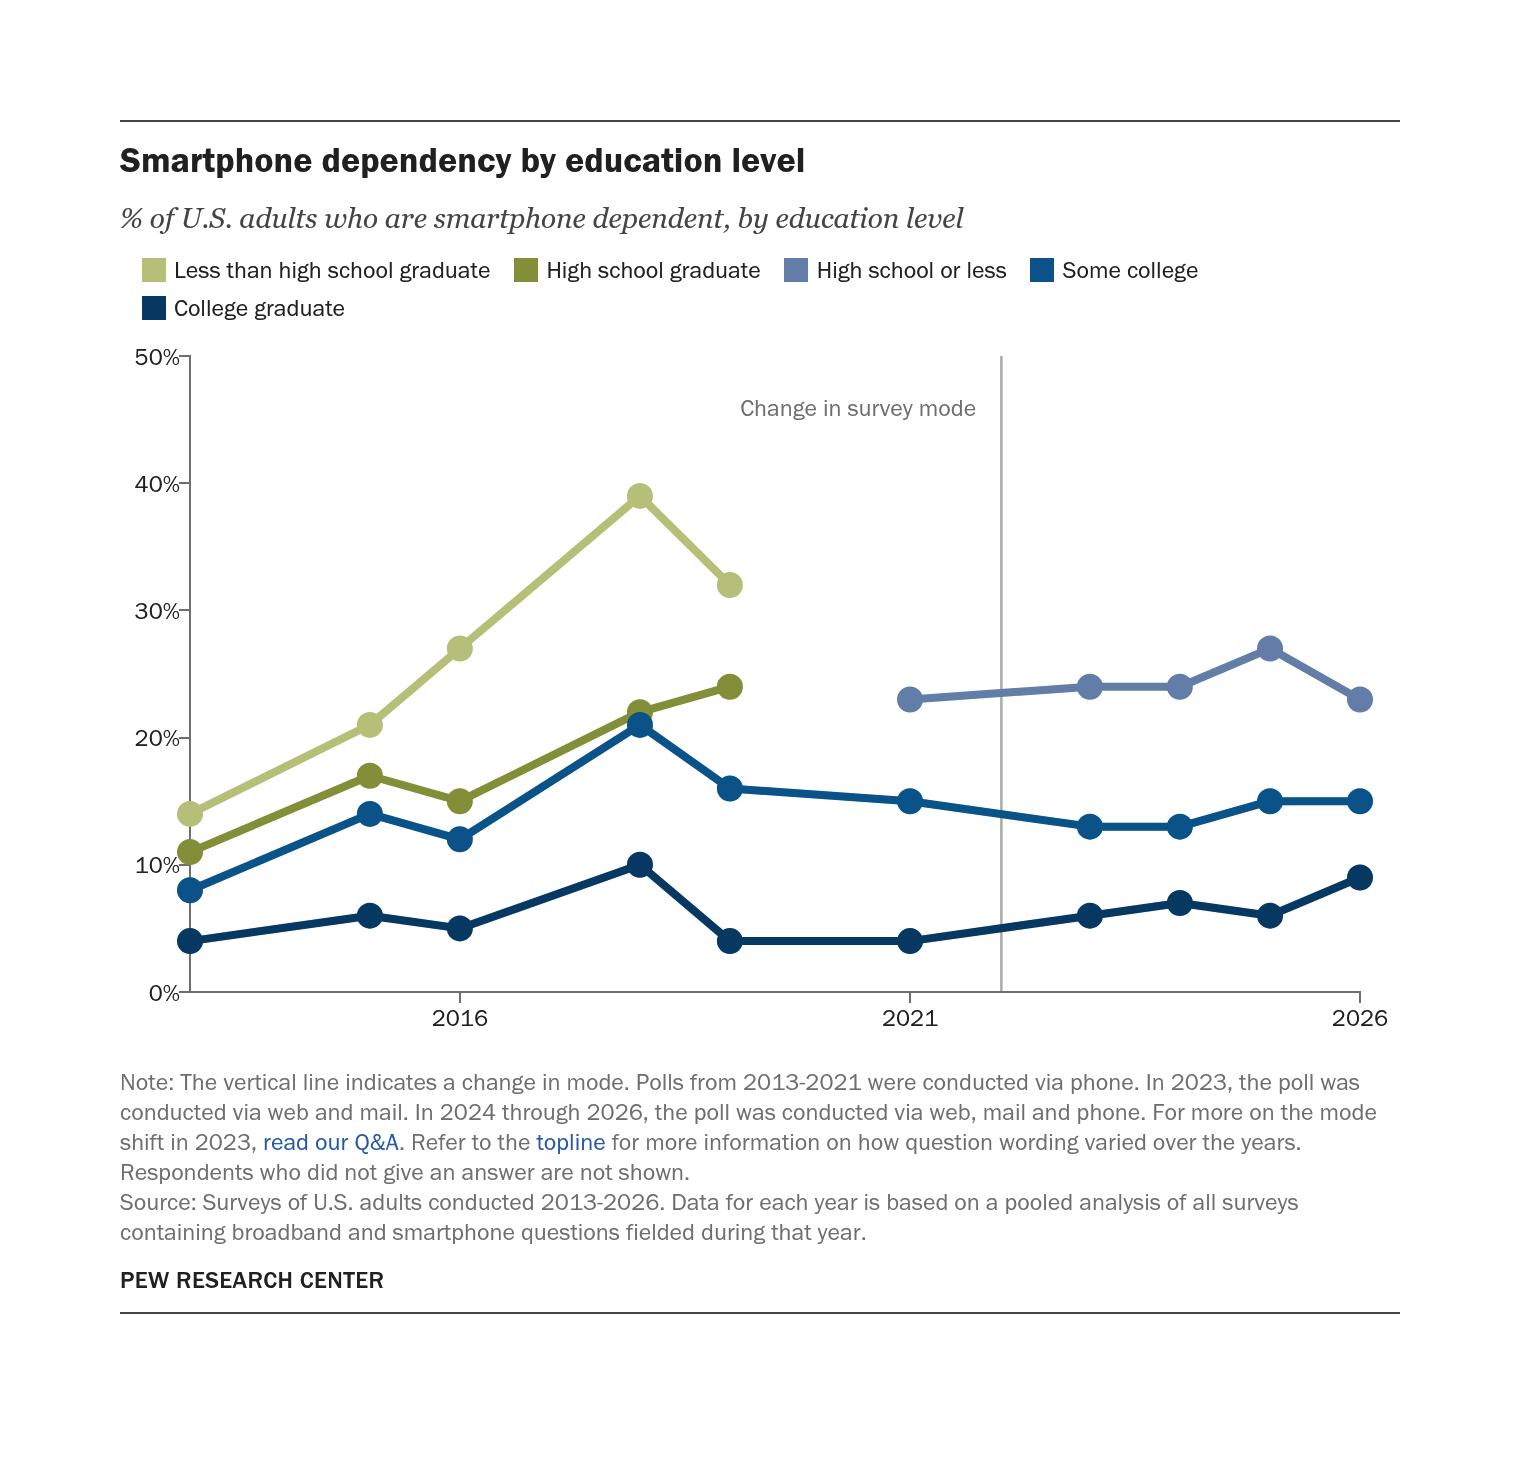
Source: Surveys of U.S. adults conducted 2013-2026. Data for each year is based on a pooled analysis of all surveys containing broadband and smartphone questions fielded during that year.
PEW RESEARCH CENTER
Smartphone dependency by education level
% of U.S. adults who are smartphone dependent, by education level
| Year | Less than high school graduate | High school graduate | High school or less | Some college | College graduate |
|---|---|---|---|---|---|
| 2013 | 14% | 11% | 8% | 4% | |
| 2015 | 21% | 17% | 14% | 6% | |
| 2016 | 27% | 15% | 12% | 5% | |
| 2018 | 39% | 22% | 21% | 10% | |
| 2019 | 32% | 24% | 16% | 4% | |
| 2021 | 23% | 15% | 4% | ||
| 2023 | 24% | 13% | 6% | ||
| 2024 | 24% | 13% | 7% | ||
| 2025 | 27% | 15% | 6% | ||
| 2026 | 23% | 15% | 9% |
Source: Surveys of U.S. adults conducted 2013-2026. Data for each year is based on a pooled analysis of all surveys containing broadband and smartphone questions fielded during that year.
PEW RESEARCH CENTER

Find out more
This fact sheet was compiled by Research Analyst Olivia Sidoti. Research Associate Michelle Faverio, Research Analyst Eugenie Park, Information Graphics Designer Sharon McGill, Digital Producer Sara Atske and Research Associate William Bishop also contributed.
Follow these links for more in-depth analysis of the impact of internet and broadband on American life.
Find more publications related to internet and technology and more benchmarks from our National Public Opinion Reference Survey (NPORS).