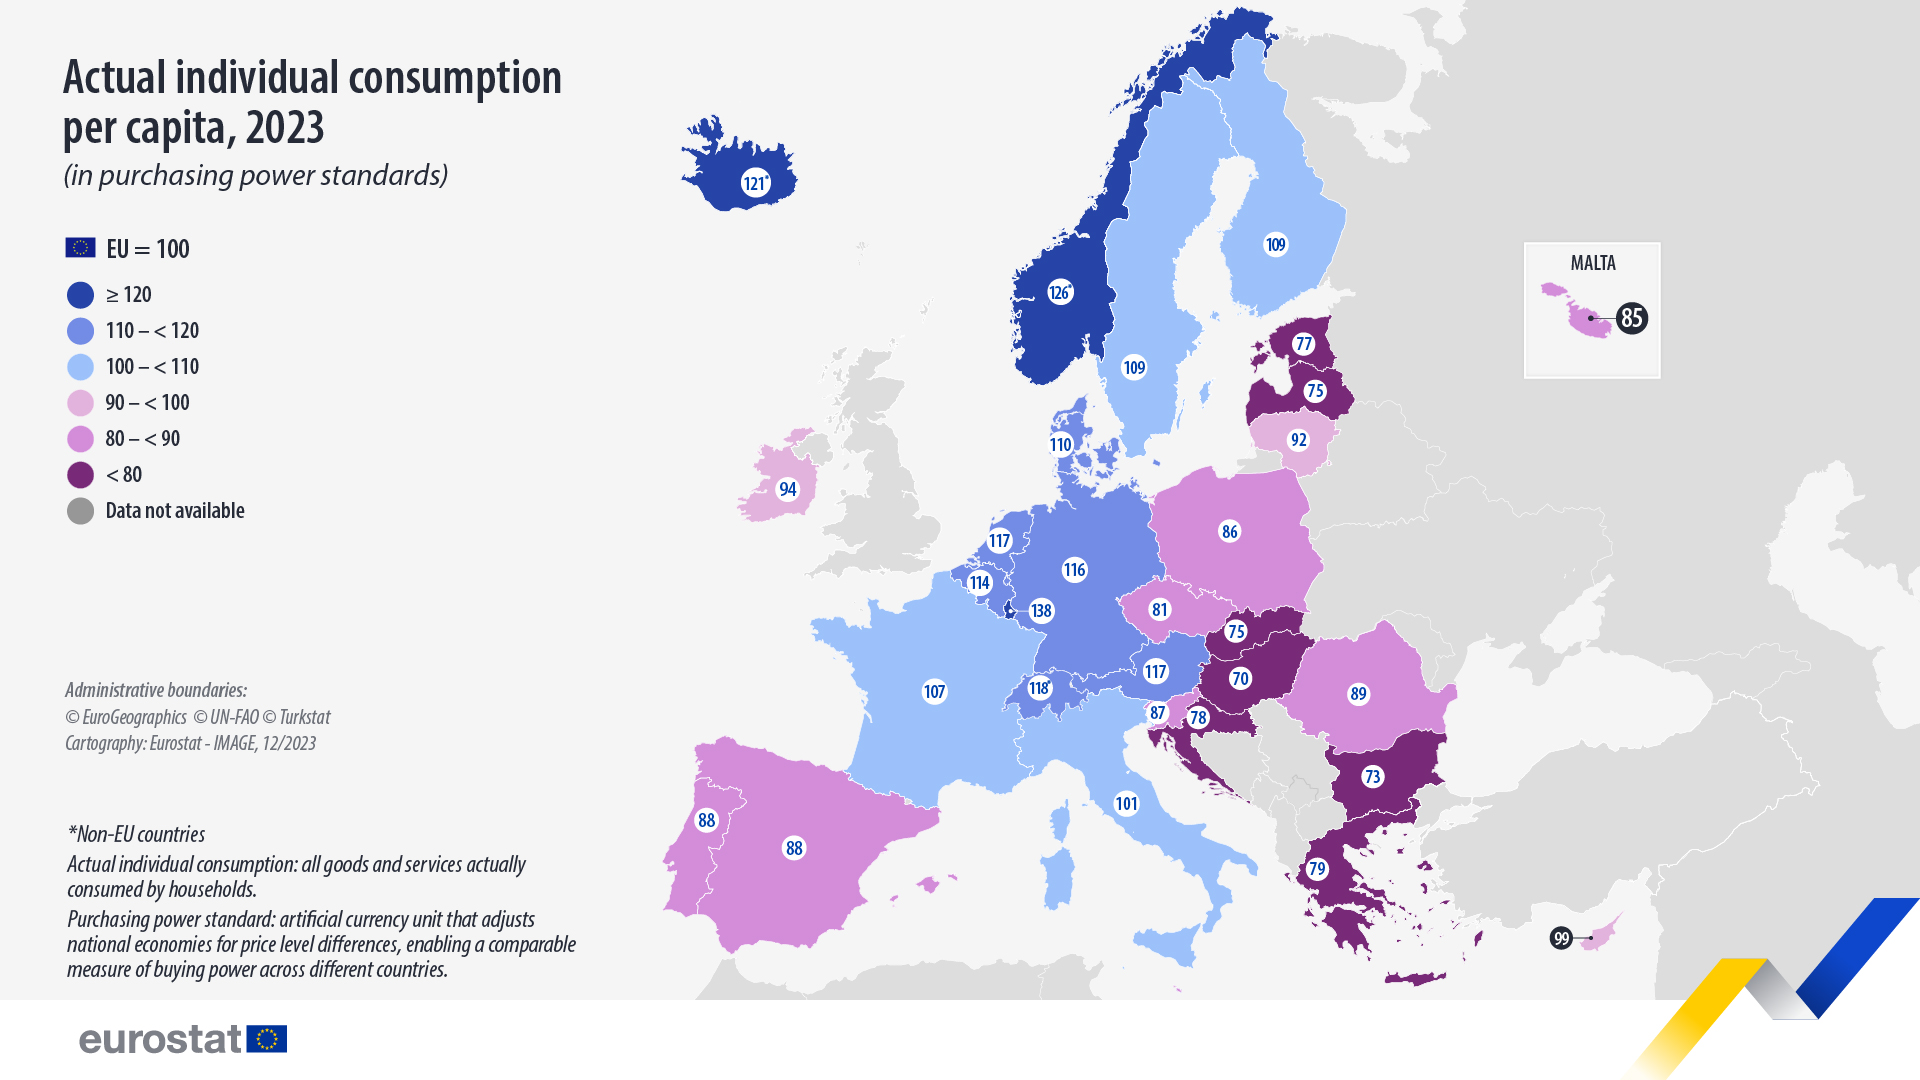
In 2023, actual individual consumption (AIC) per capita expressed in purchasing power standards (PPS) varied from 70% to 138% of the EU average across the 27 EU countries. AIC includes all goods and services that households use, irrespective of whether they were purchased and paid for by households directly, by government, or by nonprofit organizations. It can be considered as an indicator of the material welfare of households.
This information comes from recently published data on purchasing power parities (PPP). This article presents some of the findings from the more detailed account in the Statistics Explained article.
Source dataset: prc_ppp_ind
In 2023, 10 EU countries recorded AIC per capita above the EU average. The highest levels were recorded in Luxembourg (38% above the EU average), Austria and the Netherlands (both 17%).
Meanwhile, 17 EU countries recorded AIC per capita below the EU average, with the lowest levels recorded in Hungary (30% below the EU average), Bulgaria (27%), Slovakia and Latvia (both 25%).
Luxembourg and Ireland record the highest GDP per capita
Gross domestic product (GDP) per capita, a measure of economic activity, also showed substantial differences across the EU members.
GDP per capita above the EU average was recorded in 11 EU countries. It was highest in Luxembourg (139% higher than the EU average), Ireland (111%) and the Netherlands (30%). At the other end of the range, the lowest GDP per capita was recorded in Bulgaria (36% below the EU average), Greece (33%) and Latvia (29%).

Source dataset: prc_ppp_ind