As the weather starts to warm in Australia, people are beginning to look ahead to the bushfire season.
The national Seasonal Bushfire Outlook, released in August by the Australasian Fire and Emergency Service Authorities Council, identifies areas where fire risk is expected to be higher than normal this spring, based on factors including weather, climate and fuels.
The council also emphasises that bushfires can occur in regions with a normal seasonal outlook, and that conditions can vary within these regions. All communities need to understand their local conditions and prepare early.
So, how can we monitor local conditions as the season unfolds in near real-time? A new, publicly available tool made available by Geosciences Australia based on satellite observations can help by showing how vegetation moisture varies across the landscape and changes over time.
Tracking vegetation moisture from space
The new tool uses observations from the European Space Agency Sentinel-2 satellites to estimate fuel moisture content: the amount of water in vegetation relative to its dry weight. This influences how readily vegetation can ignite and burn.
As fuel moisture content declines, vegetation generally becomes more flammable. Below critical levels, which vary among vegetation types, it can ignite more easily, burn hotter and spread faster.
Sentinel-2 detects changes in the way vegetation reflects light as it gains or loses moisture. The new tool translates these observations into maps covering Australia at 20 metre resolution, with new observations available approximately every five days and a record extending back to 2015.
Zooming in on the Australian Capital Territory
What can this information tell us in practice? Let’s take the Australian Capital Territory as an example. We looked at conditions in August.
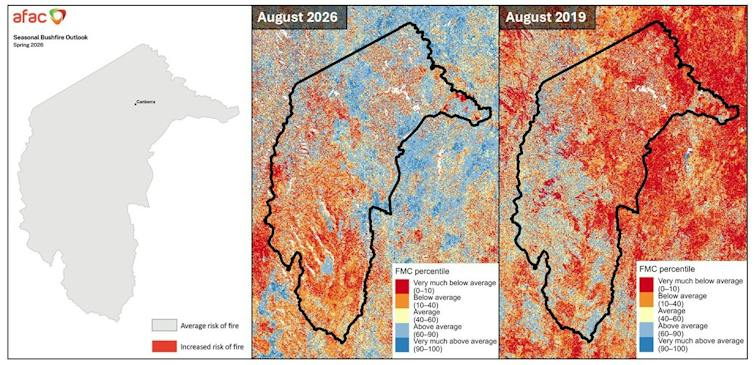
In the official spring bushfire outlook, the ACT is not identified as an area of increased fire risk. However, our more detailed picture shows big variations in how dry plants are across the territory.
Slightly more than half the territory was at least as moist as usual, but the rest – particularly in parts of the south – was drier or much drier than average.
Vegetation was generally not as dry as it was in August 2018 or 2019, the years before the 2019–20 Black Summer bushfires. In those years, roughly two-thirds of the ACT was dry or very dry.
The spatial pattern was also different. Areas that were unusually dry in August 2026 were not necessarily the same as the dry spots in 2018 and 2019.
Some of the locations that are currently drier than usual were far more wet in those earlier years.
Australasian Fire and Emergency Service Authorities Council Seasonal Outlook/Digital Earth Australia
Why does the pace of drying matter?
But current conditions are only part of the story.
How quickly vegetation is drying can also provide important information as the season unfolds. Between July and August 2026, plants dried out faster than in most of the past decade.
In dry years such as 2018 and 2019, August conditions were drier overall, but the drop in moisture between July and August was less pronounced.
In 2026, conditions are mixed. A larger portion of the ACT is classified as wet or transitioning from wet to dry, while parts of southern ACT are already unusually dry for August.
If rapid drying continues, some transitional areas could shift into the dry category later in spring. This suggests we should keep a particularly close eye on the parts of the southern ACT where vegetation is drier than in the north, drier than in previous years, and rapidly getting even drier.
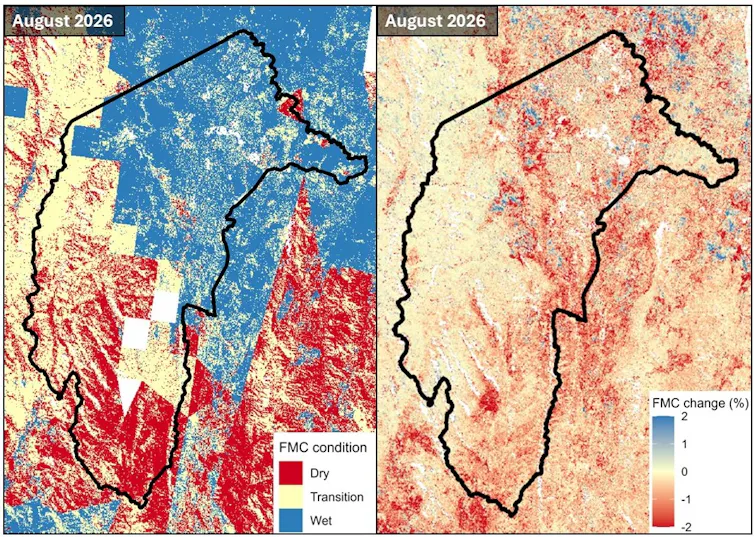
Digital Earth Australia
From monitoring to action
The ACT example illustrates how high-resolution fuel moisture content information can add local, regularly updated detail to seasonal outlooks.
A region with an average risk of fire may still contain areas where vegetation is comparatively dry, drying rapidly, or unusually dry for that location and time of year.
Applied across Australia, this approach could help agencies, land managers, Indigenous communities and landholders identify where closer monitoring, preparedness, and risk-mitigation efforts may deserve attention.
Prescribed burning provides one practical example.
As spring arrives, smoke from planned burns becomes a familiar sight around Canberra and other regions of Australia, as land managers take advantage of suitable conditions before the hotter months. But identifying and anticipating these burning windows is not simple.
High-resolution maps about how dry vegetation is can add useful information to their planning. They can show where vegetation might be within moisture levels suitable for burning (for example, not too wet nor too dry), while the pace of drying may help indicate where potential burning windows are developing or narrowing.
This could prompt closer field assessment and help managers prioritise where to monitor conditions.
Fuel moisture content alone, however, cannot determine whether or when a prescribed burn should proceed. These decisions must also consider weather, fuel load and structure, grass curing, terrain, smoke impacts, available resources and observations made on the ground.