


Most Americans think of themselves as “working class” today: Overall, 60% of U.S. adults say the term describes them well. And the identity is widely adopted by people across all income and educational groups – including half of both Americans who have a bachelor’s degree and those who are upper income.
Many Americans say ‘working class’ describes them well, but some are more likely than others to adopt the term
% of U.S. adults who say ‘working class’ describes them …

* Estimates for Asian adults are representative of English speakers only.
Note: White, Black and Asian adults include those who report being only one race and are not Hispanic; Hispanics are of any race. Family income tiers are based on adjusted 2024 earnings.
Source: Survey of U.S. adults conducted Jan. 20-26, 2026.
PEW RESEARCH CENTER
Many Americans say ‘working class’ describes them well, but some are more likely than others to adopt the term
% of U.S. adults who say ‘working class’ describes them …
| Group | Extremely well | Very well | NET Extremely/very well | grouping |
|---|---|---|---|---|
| Total | 28 | 32 | 60 | total |
| White | 29 | 32 | 62 | race |
| Hispanic | 28 | 32 | 59 | race |
| Black | 28 | 26 | 54 | race |
| Asian* | 19 | 33 | 52 | race |
| Ages 18-49 | 29 | 31 | 59 | age |
| 50+ | 28 | 33 | 61 | age |
| College grad+ | 20 | 30 | 50 | edu |
| No college degree | 33 | 33 | 66 | edu |
| income | ||||
| Upper income | 22 | 27 | 50 | income |
| Middle income | 33 | 35 | 67 | income |
| Lower income | 26 | 31 | 57 | income |
| Rep/Lean Rep | 33 | 33 | 67 | party |
| Dem/Lean Dem | 25 | 30 | 55 | party |
* Estimates for Asian adults are representative of English speakers only.
Note: White, Black and Asian adults include those who report being only one race and are not Hispanic; Hispanics are of any race. Family income tiers are based on adjusted 2024 earnings.
Source: Survey of U.S. adults conducted Jan. 20-26, 2026.
PEW RESEARCH CENTER
Working-class identification does vary by education and income: It is highest among Americans without a four-year degree and those who are middle income. But an analysis of data from a Pew Research Center survey conducted earlier this year finds that seeing oneself as working class also has a heavy political tinge and differs by race and ethnicity.
Republicans are more likely than Democrats to identify as working class – even after taking economics, occupation, education and other factors into account. Overall, 67% of Republicans and Republican leaners say “working class” describes them well, as do 55% of Democrats. And wide partisan gaps are evident across many demographic and economic groups.
Working-class identification differs by race and ethnicity. In particular, White adults are more likely than Black adults to identify as working class. About six-in-ten White (62%) and Hispanic adults (59%) overall view themselves as working class, as do roughly half of Black (54%) and Asian adults (52%).
Who identifies as working class? Many factors matter
Americans without a college degree and those who are middle income are most likely to identify as working class. But large shares of higher-income and more-educated adults also say they are part of the working class:
- 66% of adults without bachelor’s degrees say “working class” describes them extremely or very well – but half of those with degrees (50%) say this, too.
- 67% of middle-income Americans say “working class” describes them well – but so do plenty of lower- (57%) and upper-income adults (50%).
The many meanings of ‘working class’
While the working class is central to many social and political discussions in America today, those discussions often use the term in different ways – sometimes referring to very different groups of people. Is the working class made up of adults who:
The term’s ambiguity has gotten attention in its own right in recent months. At the same time, some political figures – particularly on the left – have been pressed to explain who they are including when they invoke the term.
Looking at Americans’ self-reported financial stressors, rather than income, those with lower financial stress are less likely than others to describe themselves as working class.
Even so, 50% of Americans who consistently pay their bills in full, have several months of emergency savings and report being able to meet their expenses comfortably say they consider themselves to be working class.
And while those working in blue-collar occupations are particularly likely to identify as working class (77%), so do a majority of those working in other occupations (61%).
Working-class identification has ticked up from a few years ago: In 2024, 54% of Americans said the term described them well, and 60% do so today. The shift is seen across many demographic, socioeconomic and political groups.
Partisanship is associated with working-class identification
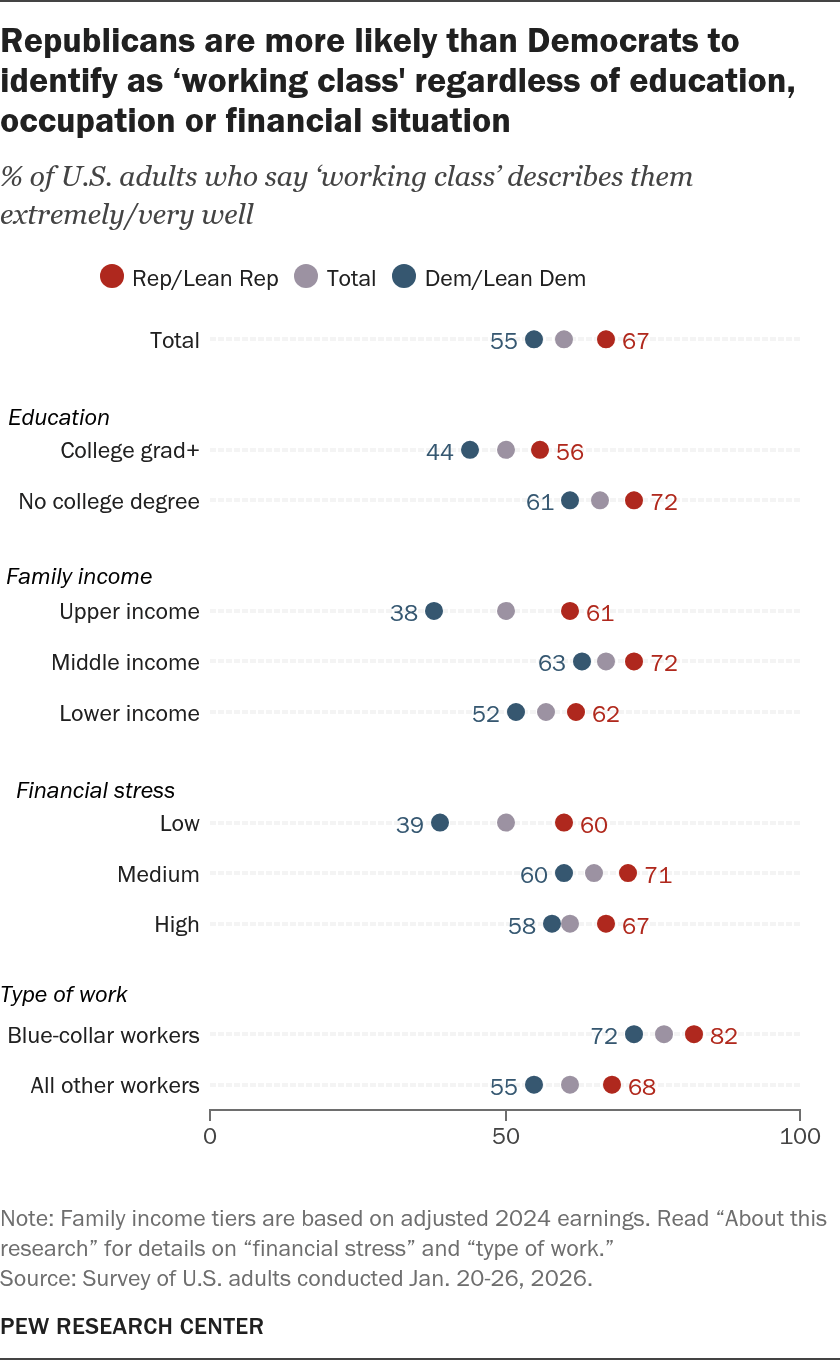
Majorities of Republicans across every educational, economic and occupational groups see themselves as working class. Democrats are generally less likely to do so – especially among higher-income and financially comfortable adults.
Education and party
While college graduates are less likely to identify as working class than those without a degree, the partisan gap is nearly identical among both those with and without a bachelor’s degree:
- 72% of Republicans without a bachelor’s degree describe themselves as working class, compared with 61% of Democrats without a degree – an 11 percentage point gap.
- There is a 12-point gap among those with a four-year degree: 56% of Republican college grads say they’re working class vs. 44% of Democratic college grads.
Republicans are more likely than Democrats to identify as ‘working class’ regardless of education, occupation or financial situation
% of U.S. adults who say ‘working class’ describes them extremely/very well
Note: Family income tiers are based on adjusted 2024 earnings. Read “About this research” for details on “financial stress” and “type of work.”
Source: Survey of U.S. adults conducted Jan. 20-26, 2026.
PEW RESEARCH CENTER
Republicans are more likely than Democrats to identify as ‘working class’ regardless of education, occupation or financial situation
% of U.S. adults who say ‘working class’ describes them extremely/very well
| Group | Rep/Lean Rep | Dem/Lean Dem | Total | grouping |
|---|---|---|---|---|
| Total | 67 | 55 | 60 | total |
| College grad+ | 56 | 44 | 50 | edu |
| No college degree | 72 | 61 | 66 | edu |
| Upper income | 61 | 38 | 50 | income |
| Middle income | 72 | 63 | 67 | income |
| Lower income | 62 | 52 | 57 | income |
| Low | 60 | 39 | 50 | financial stress |
| Medium | 71 | 60 | 65 | financial stress |
| High | 67 | 58 | 61 | financial stress |
| Blue-collar workers | 82 | 72 | 77 | type of work |
| All other workers | 68 | 55 | 61 | type of work |
Note: Family income tiers are based on adjusted 2024 earnings. Read “About this research” for details on “financial stress” and “type of work.”
Source: Survey of U.S. adults conducted Jan. 20-26, 2026.
PEW RESEARCH CENTER
Income and party
Among both low- and middle-income adults, Republicans are about 10 points more likely than Democrats to identify as working class. For instance, 72% of middle-income Republicans identify as working class, compared with 63% of Democrats.
The partisan gap is much wider – 23 points – among upper-income adults, reflecting that upper-income Democrats are much less likely than middle- or lower-income Democrats to see themselves as working class, while upper-income Republicans are about as likely as lower-income Republicans to say “working class” describes them well.
Financial stress and party
As with income, the partisan gap is widest among those who are the most financially comfortable: 60% of Republicans with few financial stresses say “working class” describes them well, compared with 39% of Democrats who are similarly financially comfortable.
In contrast, there is a relatively modest partisan gap among those under substantial financial stress: 67% of Republicans and 58% of Democrats who have substantial financial strain see themselves as working class.
Type of work and party
The partisan gap in self-identification as working class is also evident among both blue-collar workers and workers in other fields. Drawing upon occupational data collected in a 2024 Pew Research Center survey, we find:
- 82% of Republicans with blue-collar jobs identify as working class, compared with 72% of Democrats in these types of jobs.
- Among all other workers, 68% of Republicans and 55% of Democrats identify with the term.
How identification as working class differs across racial and ethnic groups
Working-class identification varies by education and partisanship – particularly among White adults
% who say ‘working class’ describes them extremely/very well …
* Estimates for Asian adults are representative of English speakers only.
Note: White, Black and Asian adults include those who report being only one race and are not Hispanic; Hispanics are of any race. Relatively small sample sizes for Black Republicans (N=114, margin of error +/- 12.2 percentage points at the 95% confidence level), Asian Republicans (N=181, margin of error +/- 10.2 percentage points) and Asian adults with no college degree (N=142, margin of error +/- 11.1 percentage points).
Source: Survey of U.S. adults conducted Jan. 20-26, 2026.
PEW RESEARCH CENTER
Working-class identification varies by education and partisanship – particularly among White adults
% who say ‘working class’ describes them extremely/very well …
| Group | College grad+ | No college degree | Dem/Lean Dem | Rep/Lean Rep | Total | grouping |
|---|---|---|---|---|---|---|
| Total | 50 | 66 | 55 | 67 | 60 | total |
| White | 48 | 71 | 54 | 69 | 62 | race |
| Hispanic | 61 | 59 | 58 | 64 | 59 | race |
| Black | 58 | 53 | 54 | 53 | 54 | race |
| Asian* | 45 | 59 | 49 | 55 | 52 | race |
* Estimates for Asian adults are representative of English speakers only.
Note: White, Black and Asian adults include those who report being only one race and are not Hispanic; Hispanics are of any race. Relatively small sample sizes for Black Republicans (N=114, margin of error +/- 12.2 percentage points at the 95% confidence level), Asian Republicans (N=181, margin of error +/- 10.2 percentage points) and Asian adults with no college degree (N=142, margin of error +/- 11.1 percentage points).
Source: Survey of U.S. adults conducted Jan. 20-26, 2026.
PEW RESEARCH CENTER
Overall, 62% of White adults, 59% of Hispanic adults, 54% of Black adults and 52% of Asian adults identify as working class.
There are wide differences within educational and partisan groups.
Education
About seven-in-ten White adults without a college degree (71%) identify as working class, compared with smaller shares of Hispanic (59%), Asian (59%) and Black adults without bachelor’s degrees (53%).
In contrast, about six-in-ten Hispanic (61%) and Black adults with college degrees (58%) describe themselves as working class. Smaller shares of White (48%) and Asian college graduates (45%) also say this.
As a result, while there are wide differences between the share of college grads and non-college grads who say they are working class among White and Asian Americans, there is not a substantial educational gap in this identification among Hispanic and Black Americans.
Partisanship
The partisan gap in identification as working class is also particularly pronounced among White adults: 69% of White Republicans and 54% of White Democrats say this description applies to them. That is a larger partisan gap than among Black adults.