
Housing affordability has emerged as a key issue in this year’s U.S. presidential election. Both Democrat Kamala Harris and Republican Donald Trump have talked about what they would do to increase the supply of affordable homes and people’s ability to buy them, though their plans have little in common.
It’s an important issue for the public, too: In a recent Pew Research Center survey, 69% of Americans said they were “very concerned” about the cost of housing, up from 61% in April 2023.
But what counts as an “affordable” home, and how many Americans are struggling to afford a place to live? This analysis tries to answer those questions, using data from U.S. Census Bureau surveys and other sources.
Pew Research Center conducted this analysis to explore housing affordability in the United States. Our major source was the U.S. Census Bureau, in particular its American Community Survey, Current Population Survey/Housing Vacancy Survey and Survey of Construction.
Some of the data in those surveys refers to both metropolitan statistical areas (MSAs) and micropolitan statistical areas (micros). The Office of Management and Budget defines MSAs as having “at least one urban area of 50,000 or more population, plus adjacent territory that has a high degree of social and economic integration with the core as measured by commuting ties.” Micros are defined similarly, except that they have at least one urban area with a population of between 10,000 and 50,000.
The data on households that spend 30% or more of their income on housing is based on the American Community Survey’s 1-year estimates. These estimates include all 393 metropolitan areas plus 137 micropolitan areas with total populations of 65,000 or more.
The share of households in each state, metropolitan area or micropolitan area is calculated only among households for which data on housing costs as a share of household income was available. Cost burden was not calculated for about 3.9 million households, or 2.9% of all U.S. households, primarily because they either have no income or pay no rent. The data covers both rented and owned units (and the latter both with and without mortgages).
We also used data from a 2024 Center survey, the Federal Housing Finance Agency (FHFA), Freddie Mac, Realtor.com and Zillow. Links to these sources, including methodological information for the Center survey, are available in the text. Realtor.com’s data on listing volumes is based on aggregated data from hundreds of local multiple listing services. Zillow’s data on median sales prices is based on all recorded home sales in a given area. Housing price index data from FHFA and Consumer Price Index data from the Census Bureau is not seasonally adjusted.
What makes a home affordable?
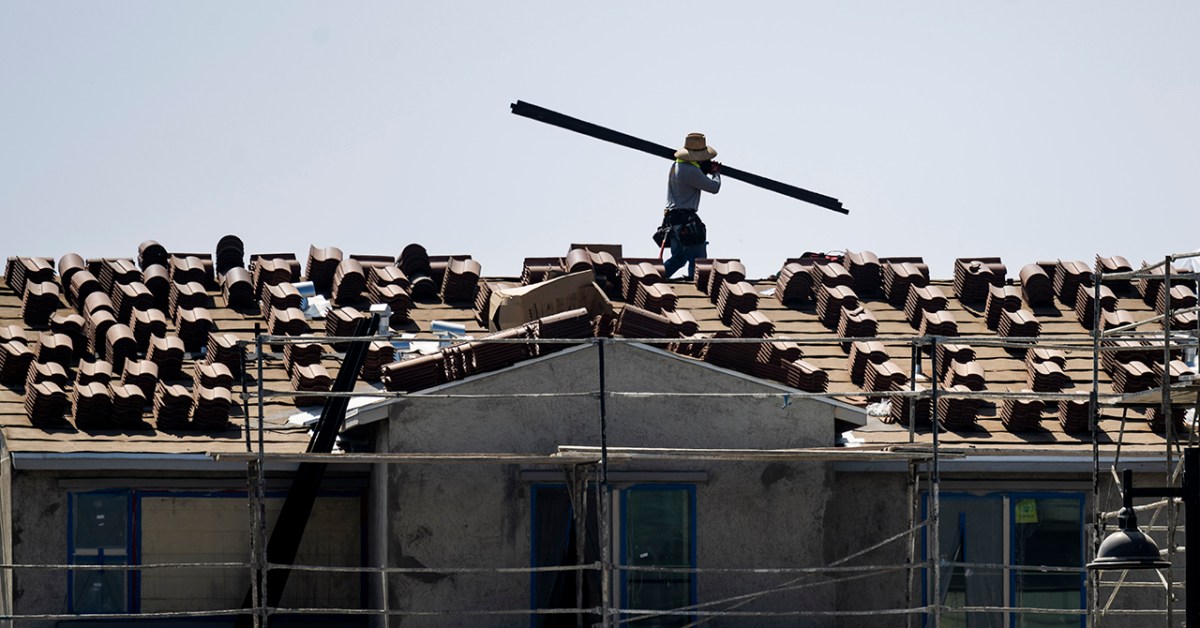
One commonly used (though also criticized) benchmark for housing affordability is that no more than 30% of household income should go toward housing costs. Households that spend more than that are considered “cost burdened” by the U.S. Department of Housing and Urban Development.
How the U.S. Census Bureau defines ‘housing costs’ and ‘gross rent’
The bureau’s American Community Survey defines “housing costs” as including rent or mortgage payments, property taxes, utilities, homeowners insurance, condominium or mobile-home fees and the like.
“Gross rent” includes the contract rent on the property as well as utilities and fuels, if paid by the tenant.
By that standard, 31.3% of American households were cost burdened in 2023, including 27.1% of households with a mortgage and 49.7% of households that rent, according to 1-year estimates from the Census Bureau’s American Community Survey (ACS). (Many more people own than rent: In the second quarter of 2024, 65.6% of occupied housing units were owned while 34.4% were rented, according to the most recent estimates from the Census Bureau’s Current Population Survey/Housing Vacancy Survey.)
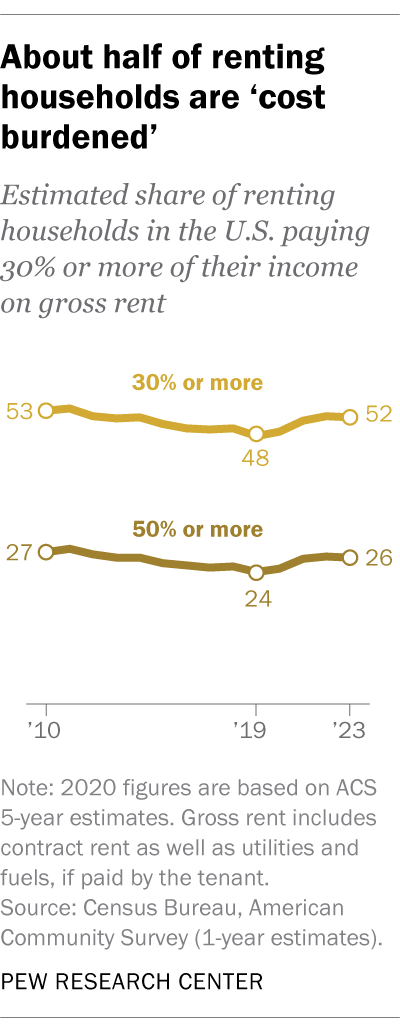
We can also look at affordability for renters, specifically, over time using a slightly different standard: the share who spent 30% or more of their income on gross rent, rather than the share who spent more than 30% on total housing costs. In 2023, about half (51.8%) of renting households paid that much in gross rent, ACS estimates show. By comparison, 53.4% of renting households paid that much in 2011. The share of renters reaching that threshold hovered around 50% for the entire 2011-2023 period.
How has the housing market changed in recent years?
The U.S. housing market, as measured by the number of active for-sale properties on local multiple listing services (MLS), shrank dramatically during the COVID-19 pandemic but has since partially rebounded.
On any given day in September 2019, according to Realtor.com, there were more than 1.2 million active MLS listings. By September 2023, that number had fallen 42.7%, to about 702,000. But as of September 2024, there were about 941,000 active listings on a given day, 34.0% more than a year earlier. (These totals exclude pending listings when that data is available.)
Similar patterns are found across the country. In September 2024, 78.9% of the 900-plus local markets Realtor.com tracks had fewer active listings than they did in September 2019, but 92.2% had more active listings than in September 2023.
Meanwhile, home prices continue to rise. The Federal Housing Finance Agency’s national House Price Index, a gauge of how selling prices for single-family homes have changed over time, was 57.8% higher in July than it was in July 2019. For comparison, the Consumer Price Index – which measures price changes for a broad range of consumer goods and services – rose 22.8% overall between September 2019 and September 2024.
Related: Prices are up in all U.S. metro areas, but some much more than others
How does housing affordability vary geographically?
Like much else involving real estate, “location, location, location” plays a key role in how housing cost burdens are distributed. That’s especially true in California, according to our analysis of 2023 ACS estimates.
The federal government identifies more than 900 metropolitan and “micropolitan” areas in the United States and Puerto Rico, based on the population of an area’s core city or town. Many of the metropolitan and micropolitan areas with the highest shares of cost-burdened households (i.e., those that spend more than 30% of their income on housing costs) are in California.
Smaller micro- and metropolitan areas, as well as largely rural states, generally tend to have lower shares of cost-burdened households. Looking at the metro- and micropolitan areas where the smallest shares of households spend more than 30% on housing, most have populations smaller than 250,000, and the majority are located in Wisconsin, Alabama or North Carolina.
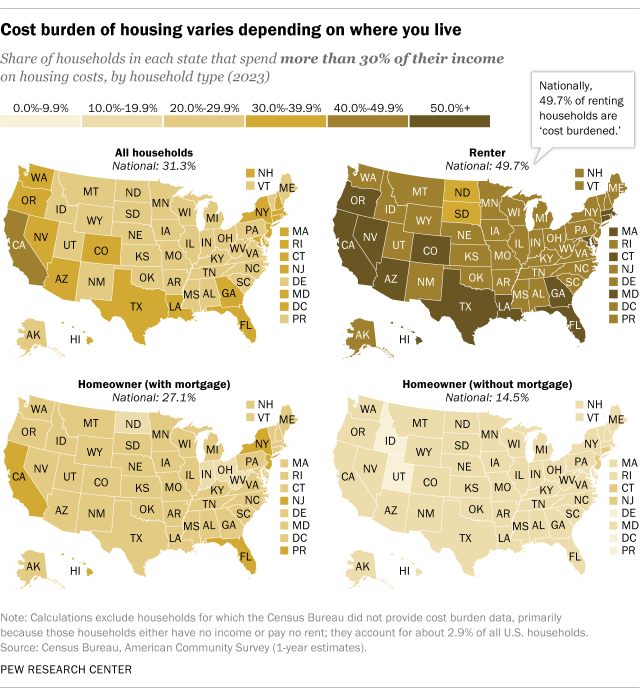
Some states have especially high shares of households spending more than 30% of their income on housing. For example, 40.6% of California households meet this threshold – including more than half (54.1%) of renters. Roughly similar shares of households in Hawaii (38.2%) and Florida (37.2%) also spend this much on housing costs, according to the 2023 ACS estimates.
At the other end of the spectrum, much smaller shares of households meet the “cost burdened” threshold in West Virginia (21.0% of households), North Dakota (22.0%), South Dakota and Iowa (23.6% each).
In every state, a greater share of renting households than homeowning ones are cost burdened when it comes to their housing costs. And homeowning households that carry a mortgage are more likely to be cost burdened than those that don’t.
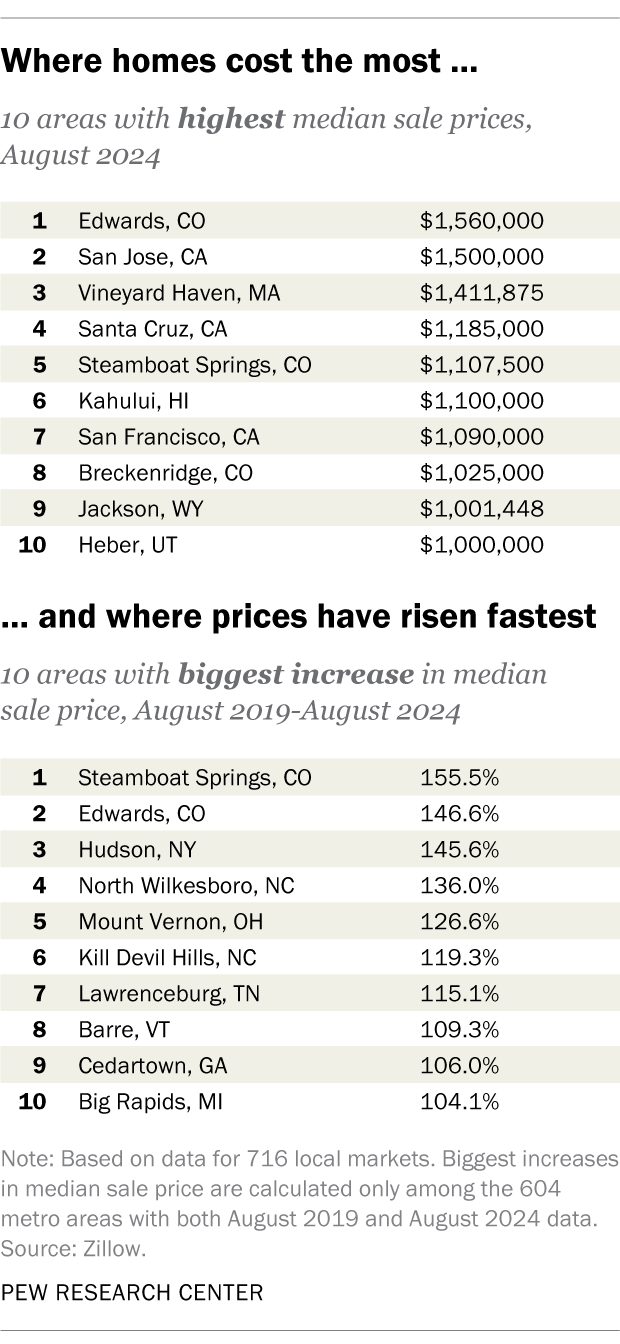
In terms of actual dollars, Edwards, Colorado (near the Vail and Beaver Creek ski areas) tops Zillow’s list of 716 local markets: The median selling price there in August 2024 was $1.56 million. But of the 604 localities for which Zillow has five years of price data, another Centennial State ski town was top of the mountain: Between August 2019 and August 2024, the median selling price in Steamboat Springs rose 155.5%, from $433,500 to $1,107,500.
What factors contribute to housing being unaffordable?
A lack of housing affordability is the product of multiple factors intersecting in sometimes unpredictable ways. Interest rates, new home construction, population growth, population shifts, rising home prices and rents, disposable incomes, and local economic conditions all affect how easy or difficult it can be to find a home you can afford in a place you want to live. Let’s take a closer look at a few of these factors.
Interest rates
Almost four-in-ten households (39.3%), or 51.6 million, carry mortgages on their homes, according to 2023 ACS estimates. Soon after the COVID-19 pandemic began, the average interest rate on a 30-year fixed mortgage fell dramatically – from 3.72% at the start of 2020 to as low as 2.65% by the start of 2021, according to data from Freddie Mac. That prompted millions of homeowners to refinance their mortgages, locking in low rates and lowering their monthly payments. (A similar refinancing wave followed the collapse of the 2000s housing bubble.)
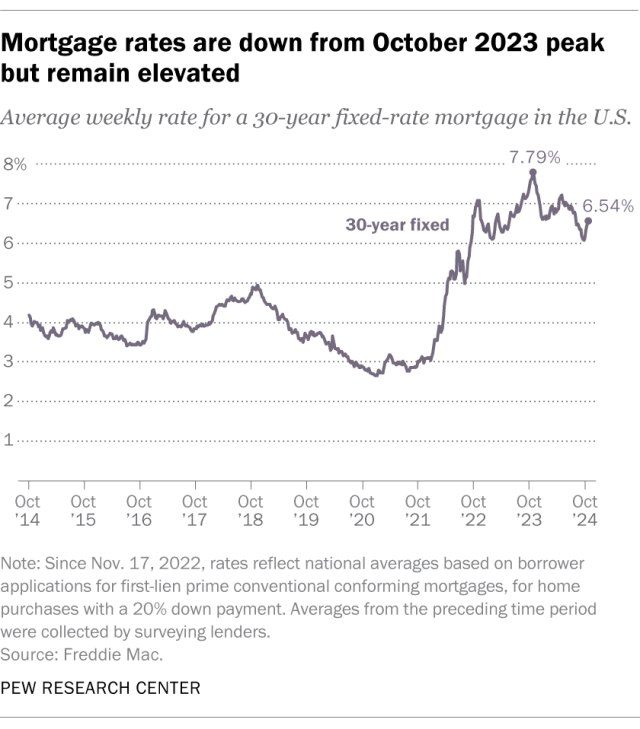
Since then, the average 30-year rate has soared as high as 7.79% (in late October 2023) and fallen to, as of late October 2024, 6.54% – roughly tracking investor expectations on inflation and the path of Federal Reserve interest-rate policy.
Still, according to a recent analysis by Federal Housing Finance Agency economists, most homeowners with fixed-rate mortgages are sitting on interest rates well below what they’d get if they took out a new mortgage today – limiting their ability, or willingness, to put their existing homes on the market. In that working paper, the economists estimate that this “lock-in” effect led to 1.33 million fewer home sales between the second quarter of 2022 and the end of 2023.
New home construction
Another way to increase the inventory of homes for sale is to build more of them. But the homebuilding industry took a deep dive during the Great Recession – falling from 2.07 million privately owned housing unit “starts” in 2005 to 554,000 in 2009 – and still has a way to go before returning to pre-crisis levels. In September 2024, housing starts were running at a seasonally adjusted annual rate of 1.35 million, according to the Census Bureau’s Survey of Construction.
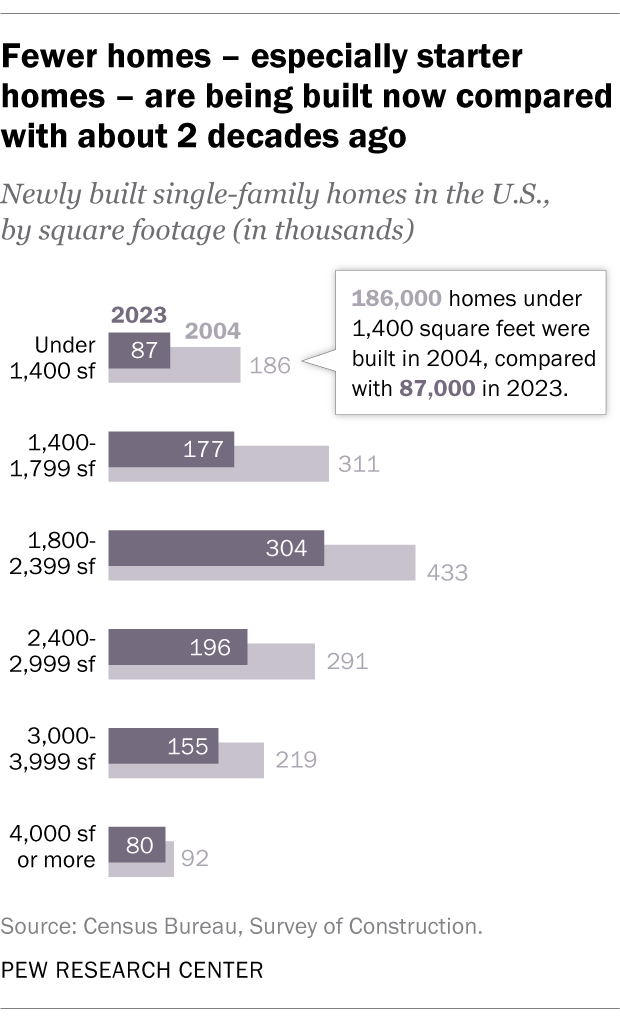
The decline has been especially pronounced in entry-level single-family homes, defined as those smaller than 1,400 square feet. The peak year this century for new homes of that size was 2004, when 186,000 were built (12.1% of all single-family homes built that year). In 2023, however, only 87,000 new single-family homes (8.7%) were under 1,400 square feet, according to the Census Bureau.
Meanwhile, 23.5% of new single-family homes in 2023 were 3,000 square feet or larger, compared with 20.3% in 2004.
Multifamily housing, such as apartment and condo buildings, may offer some relief. Coming out of the Great Recession, buildings with five or more units were completed at a steadily rising pace until rising significantly in 2023, according to the Census Bureau’s Survey of Construction. That year, 438,300 such privately owned housing buildings were completed, more than in any year since 1987. And as of September 2024, completions of buildings with five or more units were running at a seasonally adjusted annual rate of 671,000.