


This report is based on a pair of Pew Research Center surveys and a series of in-depth interviews. It draws on a nationally representative survey of U.S. adults who are members of the Center’s American Trends Panel (ATP), a survey of U.S.-based experts in artificial intelligence (AI) and 30 in-depth interviews with experts who participated in the survey. More details about each of these data sources is provided below.
Survey of U.S. adults: The American Trends Panel survey methodology
Overview
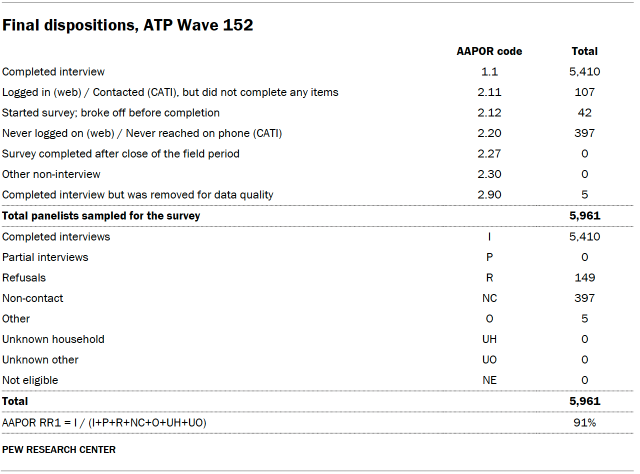
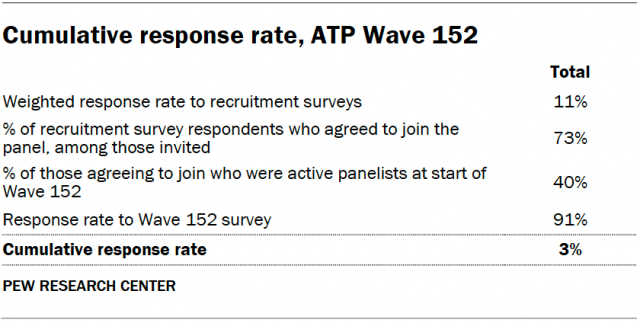
Data in this report comes from Wave 152 of the American Trends Panel (ATP), Pew Research Center’s nationally representative panel of randomly selected U.S. adults. The survey was conducted from Aug. 12 to Aug. 18, 2024. A total of 5,410 panelists responded out of 5,961 who were sampled, for a survey-level response rate of 91%.
The cumulative response rate accounting for nonresponse to the recruitment surveys and attrition is 3%. The break-off rate among panelists who logged on to the survey and completed at least one item is 1%. The margin of sampling error for the full sample of 5,410 respondents is plus or minus 1.6 percentage points.
The survey includes an oversample of Hispanic men, non-Hispanic Black men and non-Hispanic Asian adults in order to provide more precise estimates of the opinions and experiences of these smaller demographic subgroups. These oversampled groups are weighted back to reflect their correct proportions in the population.
SSRS conducted the survey for Pew Research Center via online (n=5,195) and live telephone (n=215) interviewing. Interviews were conducted in both English and Spanish.
To learn more about the ATP, read “About the American Trends Panel.”
Panel recruitment
Since 2018, the ATP has used address-based sampling (ABS) for recruitment. A study cover letter and a pre-incentive are mailed to a stratified, random sample of households selected from the U.S. Postal Service’s Computerized Delivery Sequence File. This Postal Service file has been estimated to cover 90% to 98% of the population. Within each sampled household, the adult with the next birthday is selected to participate. Other details of the ABS recruitment protocol have changed over time but are available upon request. Prior to 2018, the ATP was recruited using landline and cellphone random-digit-dial surveys administered in English and Spanish.
A national sample of U.S. adults has been recruited to the ATP approximately once per year since 2014. In some years, the recruitment has included additional efforts (known as an “oversample”) to improve the accuracy of data for underrepresented groups. For example, Hispanic adults, Black adults and Asian adults were oversampled in 2019, 2022 and 2023, respectively.
Sample design
The overall target population for this survey was noninstitutionalized persons ages 18 and older living in the United States. It featured a stratified random sample from the ATP in which Hispanic men, non-Hispanic Black men and non-Hispanic Asian adults were selected with certainty. The remaining panelists were sampled at rates designed to ensure that the share of respondents in each stratum is proportional to its share of the U.S. adult population to the greatest extent possible. Respondent weights are adjusted to account for differential probabilities of selection as described in the Weighting section below.
Questionnaire development and testing
The questionnaire was developed by Pew Research Center in consultation with SSRS. The web program used for online respondents was rigorously tested on both PC and mobile devices by the SSRS project team and Pew Research Center researchers. The SSRS project team also populated test data that was analyzed in SPSS to ensure the logic and randomizations were working as intended before launching the survey.
Incentives
All respondents were offered a post-paid incentive for their participation. Respondents could choose to receive the post-paid incentive in the form of a check or gift code to Amazon.com. Incentive amounts ranged from $5 to $15 depending on whether the respondent belongs to a part of the population that is harder or easier to reach. Differential incentive amounts were designed to increase panel survey participation among groups that traditionally have low survey response propensities.
Data collection protocol
The data collection field period for this survey was Aug. 12 to Aug. 18, 2024. Surveys were conducted via self-administered web survey or by live telephone interviewing.
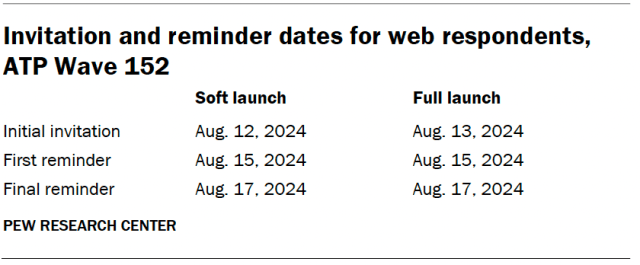
For panelists who take surveys online: Postcard notifications were mailed to a subset on Aug. 12. Survey invitations were sent out in two separate launches: soft launch and full launch. Sixty panelists were included in the soft launch, which began with an initial invitation sent on Aug. 12. All remaining English- and Spanish-speaking sampled online panelists were included in the full launch and were sent an invitation on Aug. 13.
Panelists participating online were sent an email invitation and up to two email reminders if they did not respond to the survey. ATP panelists who consented to SMS messages were sent an SMS invitation with a link to the survey and up to two SMS reminders.
For panelists who take surveys over the phone with a live interviewer: Prenotification postcards were mailed on Aug. 7, and reminder postcards were mailed on Aug. 12. The CATI soft launch took place on Aug. 12 and involved dialing until a total of eight interviews had been completed. All remaining English- and Spanish-speaking sampled CATI panelist numbers were dialed throughout the remaining field period. CATI panelists receive up to six calls from trained SSRS interviewers.
Data quality checks
To ensure high-quality data, Center researchers performed data quality checks to identify any respondents showing patterns of satisficing. This includes checking for whether respondents left questions blank at very high rates or always selected the first or last answer presented. As a result of this checking, five ATP respondents were removed from the survey dataset prior to weighting and analysis.
Weighting

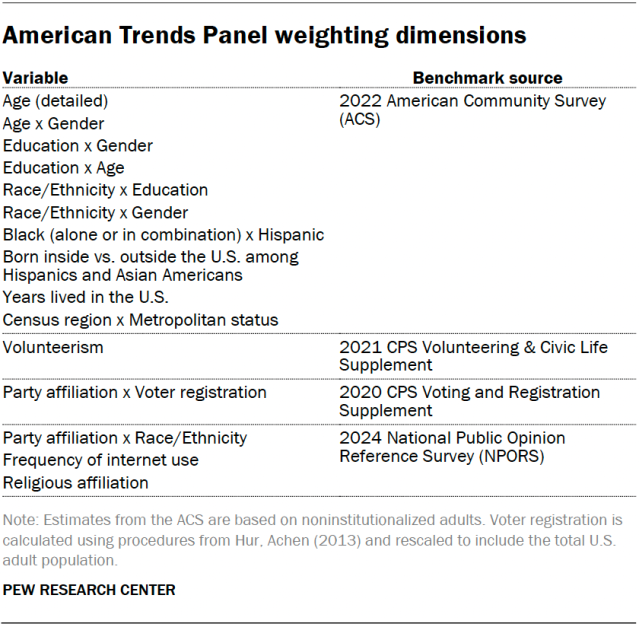
The ATP data is weighted in a process that accounts for multiple stages of sampling and nonresponse that occur at different points in the panel survey process. First, each panelist begins with a base weight that reflects their probability of recruitment into the panel. These weights are then calibrated to align with the population benchmarks in the accompanying table to correct for nonresponse to recruitment surveys and panel attrition. If only a subsample of panelists was invited to participate in the wave, this weight is adjusted to account for any differential probabilities of selection.
Among the panelists who completed the survey, this weight is then calibrated again to align with the population benchmarks identified in the accompanying table. The weight is then trimmed at approximately the 1st and 99th percentiles to reduce the loss in precision stemming from variance in the weights. Sampling errors and tests of statistical significance take into account the effect of weighting.
The following table shows the unweighted sample sizes and the error attributable to sampling that would be expected at the 95% level of confidence for different groups in the survey.

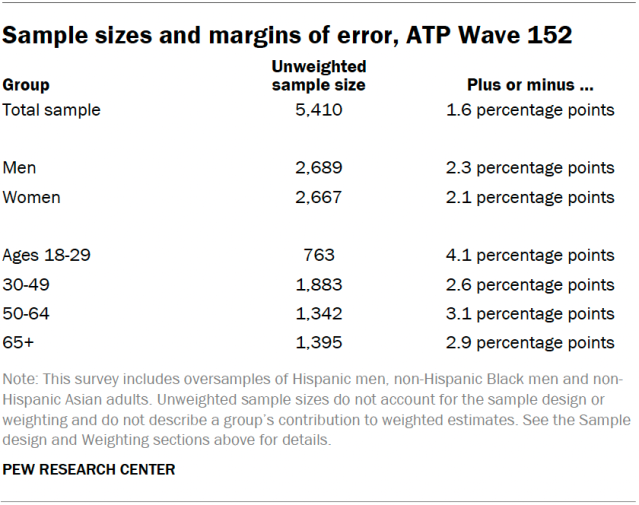
Sample sizes and sampling errors for other subgroups are available upon request. In addition to sampling error, one should bear in mind that question wording and practical difficulties in conducting surveys can introduce error or bias into the findings of opinion polls.
A note about the Asian adult sample
This survey includes a total sample size of 551 Asian adults. The sample primarily includes English-speaking Asian adults and, therefore, may not be representative of the overall Asian adult population. Despite this limitation, it is important to report the views of Asian adults on the topics in this study. As always, Asian adults’ responses are incorporated into the general population figures throughout this report.
Dispositions and response rates


Survey of AI experts
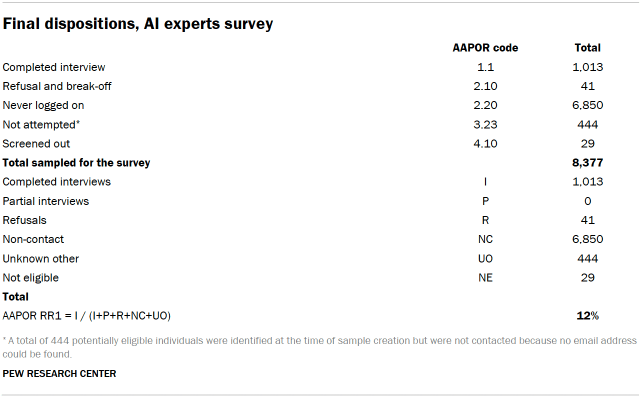
The survey of artificial intelligence (AI) experts is a national survey of 1,013 AI experts living in the United States, conducted for Pew Research Center by SSRS. Expert responses are unweighted and are only representative of the views of those who responded. The survey was administered online in English from Aug. 14 to Oct. 31, 2024.
For this study, the population of AI experts is defined as U.S.-based individuals whose work or research relates to artificial intelligence and who presented at or published in any of 21 different AI-focused conferences in 2023 and 2024.
Because there is no definitive source of population benchmarks for this group, responses from the expert survey are unweighted. They are only representative of the views of experts who responded to the survey. Appendix A has a detailed demographic profile of responses we received, including by gender, race and ethnicity, employment status, and sector.
The margin of sampling error for the complete sample of 1,013 respondents is plus or minus 3.1 percentage points.
Sample design
There is no readily available list of AI experts living in the United States that could serve as a sampling frame for this survey. To create the sample, Center researchers compiled a list of authors and presenters from a wide range of AI-focused conferences from 2023 and 2024. These conferences cover topics related to artificial intelligence, including research, development, application, and ethical and social science implications. The list was developed in consultation with external advisers on the project (refer to the end of this methodology) and was designed to capture as diverse and wide a range of perspectives on AI as possible. The final selection was the following 21 conferences:
- Ai4 (2023)
- International Conference on Artificial Intelligence Applications and Innovations (AIAI) (2024)
- AI and Algorithms in Government Conference (2024)
- AI and Big Data Expo North America (2023)
- AI Hardware and Edge AI Summit (2023)
- AI and Society Conference: Government Policy and Law at the University of Missouri (2024)
- AI and Tech Live (2023)
- AI in Finance Summit New York (2024)
- The AI Summit New York (2023)
- Association for the Advancement of Artificial Intelligence Conference on Artificial Intelligence (AAAI) (2023)
- AAAI/ACM Conference on Artificial Intelligence, Ethics and Society (AIES) (2023)
- Association for Computing Machinery Conference on Fairness, Accountability and Transparency (FAccT) (2023)
- The Conference and Workshop on Neural Information Processing Systems (NeurIPS) (2023), including NeurIPS affinity groups (Black in AI, Global South in AI, Indigenous in AI/ML, Latinx in AI, Muslims in ML, New in ML, North Africans in ML, Queer in AI, Women in ML)
- Equity and Access in Algorithms, Mechanisms and Optimization (EAAMO) (2023)
- GovAI (2023)
- NLP Summit Healthcare (2023)
- Open Data Science Conference (ODSC) East (2023)
- Open Data Science Conference (ODSC) West (2023)
- Summit on AI and Democracy (2023)
- World Summit AI (2023)
- World Summit AI Americas (2023)
Center researchers compiled a list of every individual who presented at or whose research was published in the proceedings of each conference. For many conferences, including AAAI, NeurIPS, FAccT and AIES, the list of participants was obtained from published conference proceedings which typically included names, affiliations and email addresses for the authors of each paper. For conferences in which the proceedings were not available or did not exist, the publicly available speaker list was used.
Individuals who were identified as living outside the U.S. based on their organizational affiliation or email address were excluded from the list. When U.S. residency was uncertain, researchers consulted professional profiles, LinkedIn, personal websites and other sources of publicly available information to make a determination.
For individuals whose email address was not available through conference proceedings, an email finder service was used to obtain contact information. Researchers made multiple passes through the list of names in order to include as many email addresses as possible for the sample. Finally, the sample was processed and cleaned to identify and remove any duplicates.
Altogether, this process identified a total of 8,377 individuals that were potentially eligible to participate in the survey. Researchers were able to obtain email addresses for 7,933 of the individuals, for a collection rate of 94.7%, all of whom were included in the sample.
Screening and eligibility
To confirm eligibility, at the beginning of the survey respondents were asked two questions: (1) if their work or research relates in any way to artificial intelligence (AI), machine learning, or related topics; (2) if they currently live in the United States. Respondents were deemed eligible if they responded yes to both questions. If respondents indicated that their work or research does not relate in any way to artificial intelligence (AI), machine learning, or related topics; or do not live in the U.S.; or refused to answer either screening question, they were deemed ineligible and the interview was terminated. A total of 29 respondents were determined to be ineligible based on this screener.
Data collection
An initial soft launch was conducted in which survey invitations were sent to 200 cases on Aug. 14, 2024. A second batch of 400 cases was sent the following day, Aug. 15. Sampled individuals were invited via email to take the survey online in English. The invitation included links to the survey and FAQs about the study. The email also included a link allowing respondents to unsubscribe if they did not wish to participate in the study.
The soft launch yielded very few completed interviews and prompted us to make several changes to the data collection protocol. We paused data collection until after the start of the fall academic year in the hope that academic researchers would be easier to contact. The survey invitations were also revised to be more appealing and emphasize topic salience.
We also conducted an experiment to determine if the addition of an incentive would improve completion rates. Invitations for the incentive experiment were emailed to a total of 400 cases on Sept. 20, 2024, in which a random half were offered a $25 Visa virtual gift card if they completed the survey and the remainder were not offered an incentive. Based on the results of the experiment, a $25 post-paid incentive in the form of a Visa gift card was incorporated into the final data collection protocol.

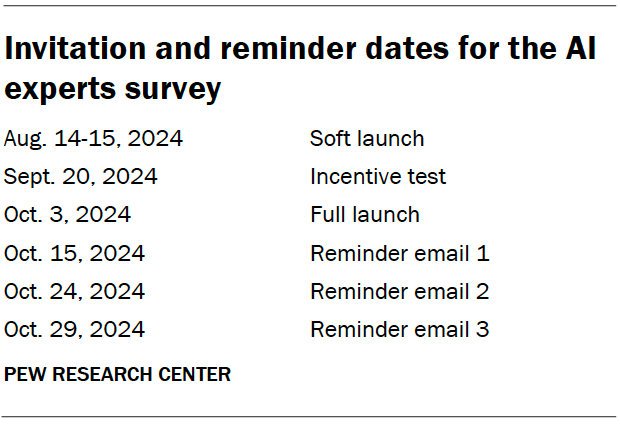
The full launch of the survey and initial invitation took place on Oct. 3, 2024. A series of three reminder emails were sent approximately one week apart to individuals who had not completed the survey, unless they unsubscribed.
Dispositions and response rates

In-depth AI expert interviews
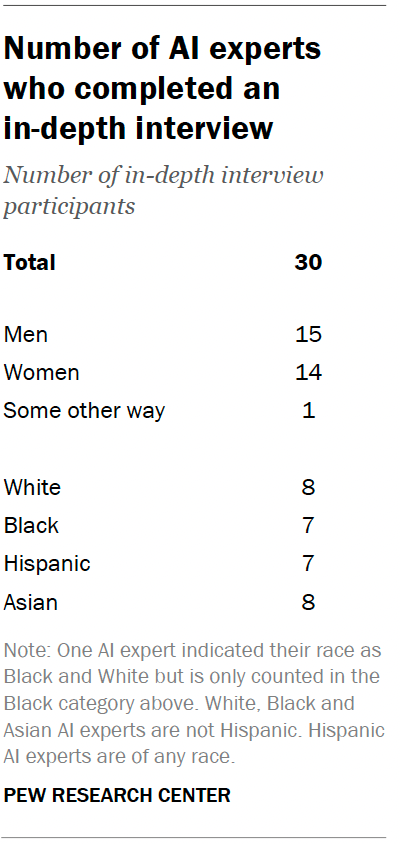
Pew Research Center worked with SSRS to conduct 30 individual in-depth interviews between Oct. 18 and Nov. 26, 2024. The goal of these was to further explore the views of AI experts on topics we covered in the survey – including the societal impact of AI, representation in the AI workforce, bias in AI models and issues of regulation and responsible use of AI. The interviews were also designed to hear from AI experts across a range of different demographic dimensions, including race, ethnicity and gender. However, the in-depth interviews are not representative of any demographic group or AI experts as a whole.
Interview recruitment
AI experts were recruited at the end of the survey of AI experts described above. A single question asked AI experts if they would be willing to take part in an online interview for Pew Research Center to get more detail on the topic of AI and ensure that the researchers hear from a range of voices. The question also provided information about how long the interview would be, how information would be used and compensation.
AI experts who indicated they were willing to participate in an interview were then asked if they could complete an online interview and had access to a computer or mobile device where they could access Zoom, high speed internet, and a quiet and private space from which they could participate uninterrupted. For scheduling purposes, they were also asked for their contact information.

Overall, 57% of AI experts surveyed indicated they were willing to participate in an interview, and all met criteria to participate. Center researchers worked with SSRS to prioritize participants for scheduling.
In line with the goals of the project, a roughly equal number of participants across race and ethnicity (White, Black, Hispanic, Asian) and gender (men and women) were selected, along with a mix of job sectors.
On a rolling basis, SSRS provided Center researchers with ID numbers and corresponding demographic information from those who agreed to participate. Center researchers then provided SSRS with selected ID numbers to contact and interview.
Interviews
Four professional moderators conducted the online interviews in English on behalf of SSRS and Pew Research Center. White, Black and Asian experts were matched with moderators of the same race as them. Hispanic experts were matched with a Hispanic moderator.
Each moderator followed the same interview guide, which covered four topics:
- AI’s impact on society today and in the future
- Representation among AI designers
- Bias in AI
- Regulating AI
The full interview guide is available upon request.
Interviews were conducted online using Zoom. Each interview lasted for approximately 30 minutes. Each participant received a $100 Visa virtual gift card. The interviews were recorded. After each interview, SSRS provided the audio recording and transcript to Center researchers. Transcripts were anonymized and any identifying information was removed.
Analysis
Four Center researchers reviewed the audio recordings and transcripts to create a coding scheme based on the content in the interviews to help identify key quotations for inclusion in the report. After the coding scheme was established, each researcher coded one transcript independently, then discussed their coding of this transcript together to ensure that the coding scheme was being used similarly across researchers. The coding scheme was modified and refined for accuracy and clarity. The remaining transcripts were then divided among the researchers and coded independently.
After all transcripts were coded, codes were reviewed to identify common themes across interviews. Based on the common themes, quotations were selected that represented the themes or provided details to complement survey findings on a similar topic.
Quotations featured in the report have been lightly edited for grammar and clarity. Quotations are not representative of larger demographic groups; instead, they are intended to provide details on individual experts’ views of AI. Views expressed by participants have not been fact-checked.
Advisory board
In addition to a team of subject area and methodological experts at Pew Research Center, the project was also guided by an advisory board of three members. This board included experts in a variety of areas related to artificial intelligence, including computer science, ethics, biases and other areas:
- Shreya Singh Hernández, Data Equity Lead, Aspen Digital, Aspen Institute
- Nicol Turner Lee, Director of Technology Innovation, Brookings Institution
- C. Raymond Perrault, Distinguished Scientist, SRI International
Advisers provided feedback at various key points during the report, including on the sample design, the questionnaire and a draft of the report. Pew Research Center remains solely responsible for all aspects of the research, including any errors associated with its products and findings. The feedback shared for this project is solely that of the advisers and does not express the views, policies or positions of their respective employers.


