


The American Trends Panel survey methodology
Overview
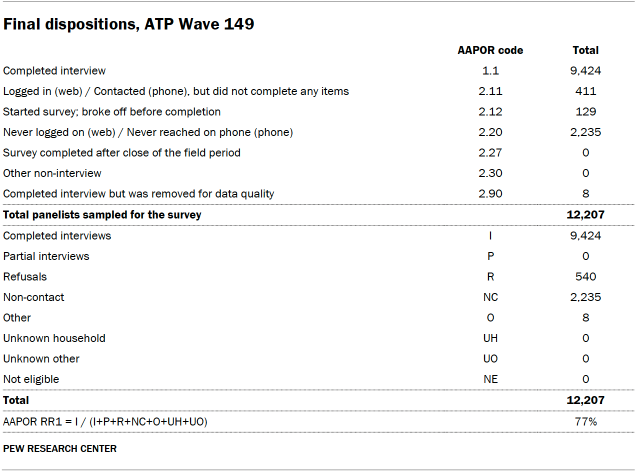
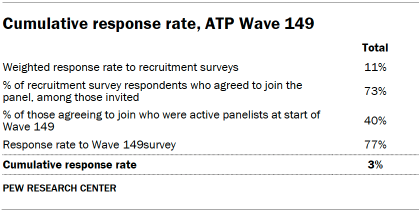
Data in this report comes from Wave 149 of the American Trends Panel (ATP), Pew Research Center’s nationally representative panel of randomly selected U.S. adults. The survey was conducted from July 1 to July 7, 2024. A total of 9,424 panelists responded out of 12,207 who were sampled, for a survey-level response rate of 77%.
The cumulative response rate accounting for nonresponse to the recruitment surveys and attrition is 3%. The break-off rate among panelists who logged on to the survey and completed at least one item is 1%. The margin of sampling error for the full sample of 9,424 respondents is plus or minus 1.3 percentage points.
SSRS conducted the survey for Pew Research Center via online (n=9,106) and live telephone (n=318) interviewing. Interviews were conducted in both English and Spanish.
To learn more about the ATP, read “About the American Trends Panel.”
Panel recruitment
Since 2018, the ATP has used address-based sampling (ABS) for recruitment. A study cover letter and a pre-incentive are mailed to a stratified, random sample of households selected from the U.S. Postal Service’s Computerized Delivery Sequence File. This Postal Service file has been estimated to cover 90% to 98% of the population. Within each sampled household, the adult with the next birthday is selected to participate. Other details of the ABS recruitment protocol have changed over time but are available upon request. Prior to 2018, the ATP was recruited using landline and cellphone random-digit-dial surveys administered in English and Spanish.
A national sample of U.S. adults has been recruited to the ATP approximately once per year since 2014. In some years, the recruitment has included additional efforts (known as an “oversample”) to improve the accuracy of data for underrepresented groups. For example, Hispanic adults, Black adults and Asian adults were oversampled in 2019, 2022 and 2023, respectively.
Sample design
The overall target population for this survey was noninstitutionalized persons ages 18 and older living in the United States. All active panel members were invited to participate in this wave.
Questionnaire development and testing
The questionnaire was developed by Pew Research Center in consultation with SSRS. The web program used for online respondents was rigorously tested on both PC and mobile devices by the SSRS project team and Pew Research Center researchers. The SSRS project team also populated test data that was analyzed in SPSS to ensure the logic and randomizations were working as intended before launching the survey.
Incentives
All respondents were offered a post-paid incentive for their participation. Respondents could choose to receive the post-paid incentive in the form of a check or gift code to Amazon.com. Incentive amounts ranged from $5 to $20 depending on whether the respondent belongs to a part of the population that is harder or easier to reach. Differential incentive amounts were designed to increase panel survey participation among groups that traditionally have low survey response propensities.
Data collection protocol
The data collection field period for this survey was July 1 to July 7, 2024. Surveys were conducted via self-administered web survey or by live telephone interviewing.
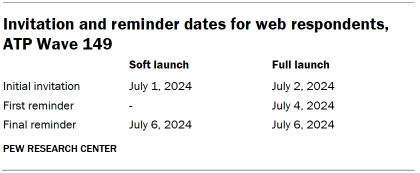
For panelists who take surveys online: Postcard notifications were mailed to a subset on July 1. Survey invitations were sent out in two separate launches: soft launch and full launch. Sixty online panelists were included in the soft launch, which began with an initial invitation sent on July 1. All remaining English- and Spanish-speaking online panelists were included in the full launch and were sent an invitation on July 2.
Panelists participating online were sent an email invitation and up to two email reminders if they did not respond to the survey. ATP panelists who consented to SMS messages were sent an SMS invitation with a link to the survey and up to two SMS reminders.
For panelists who take surveys over the phone with a live interviewer: Prenotification postcards were mailed on June 26, and reminder postcards were mailed on July 1. Ten randomly selected panelists responding by phone were included in the soft launch, which began with an initial invitation sent on July 1. All remaining English- and Spanish-speaking panelists responding by phone were included in the full launch. Panelists responding by phone receive up to six calls from trained SSRS interviewers.
Data quality checks
To ensure high-quality data, Center researchers performed data quality checks to identify any respondents showing patterns of satisficing. This includes checking for whether respondents left questions blank at very high rates or always selected the first or last answer presented. As a result of this checking, eight ATP respondents were removed from the survey dataset prior to weighting and analysis.
Weighting
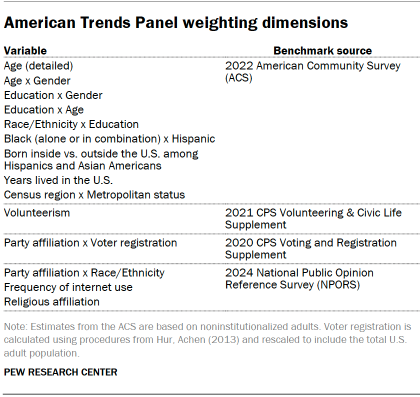
The ATP data is weighted in a process that accounts for multiple stages of sampling and nonresponse that occur at different points in the panel survey process. First, each panelist begins with a base weight that reflects their probability of recruitment into the panel. These weights are then calibrated to align with the population benchmarks in the accompanying table to correct for nonresponse to recruitment surveys and panel attrition. If only a subsample of panelists was invited to participate in the wave, this weight is adjusted to account for any differential probabilities of selection.
Among the panelists who completed the survey, this weight is then calibrated again to align with the population benchmarks identified in the accompanying table. The weight is then trimmed at approximately the 1st and 99th percentiles to reduce the loss in precision stemming from variance in the weights. This trimming is performed separately among non-Hispanic Black, non-Hispanic Asian, Hispanic and all other respondents. Sampling errors and tests of statistical significance take into account the effect of weighting.

The following table shows the unweighted sample sizes and the error attributable to sampling that would be expected at the 95% level of confidence for different groups in the survey.

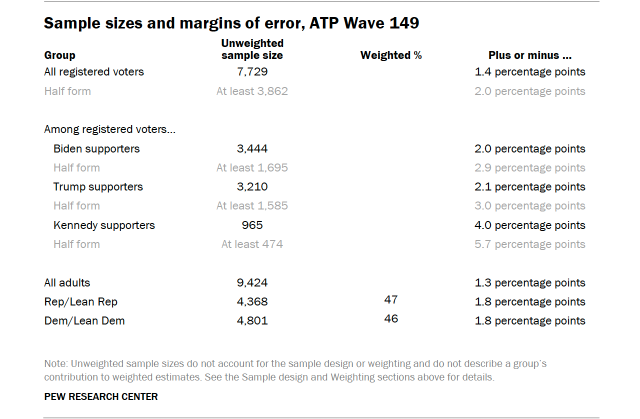
Sample sizes and sampling errors for other subgroups are available upon request. In addition to sampling error, one should bear in mind that question wording and practical difficulties in conducting surveys can introduce error or bias into the findings of opinion polls.
Dispositions and response rates


Validated voters
Members of Pew Research Center’s nationally representative American Trends Panel were matched to public voting records from national commercial voter files in an attempt to find records for voting in the 2016 and 2020 general elections. Validated voters are citizens who told us in a post-election survey that they voted in a given election and have a record for voting in that election in a commercial voter file. Nonvoters are citizens who were not found to have a record of voting in any of the voter files or told us they did not vote.
In an effort to accurately locate official voting records, up to three commercial voter files were searched for each panelist. The number of commercial files consulted varied by when a panelist was recruited to the ATP. Three files were used for panelists recruited in 2022 or before, while one file was used for panelists recruited in 2023. Altogether, files from four different vendors were used, including two that serve conservative and Republican organizations and campaigns, one that serves progressive and Democratic organizations and campaigns, and one that is nonpartisan.
Additional details and caveats about the validation of votes in 2016 and 2020 can be found in these methodological reports:
© Pew Research Center 2024


