


The following table details the results of a series of statistical models predicting various measures related to people’s attitudes toward electric vehicles from a set of explanatory variables, or predictors. These models can be interpreted as estimating the effect of proximity to charging infrastructure on these outcomes of interest, while controlling for other factors related to attitudes towards EVs such as urbanicity, political ideology and socioeconomic status.
The models used are binary logistic regression models based on the full sample of U.S. adults surveyed for this study. The analyses are based on the weighted sample, thus adjusting for differences in the probability of selection and nonresponse differences across groups. Results are reported as statistically significant based on a p value threshold of 0.05. Each model omits respondents who gave no response to one or more of the survey questions included in the models.
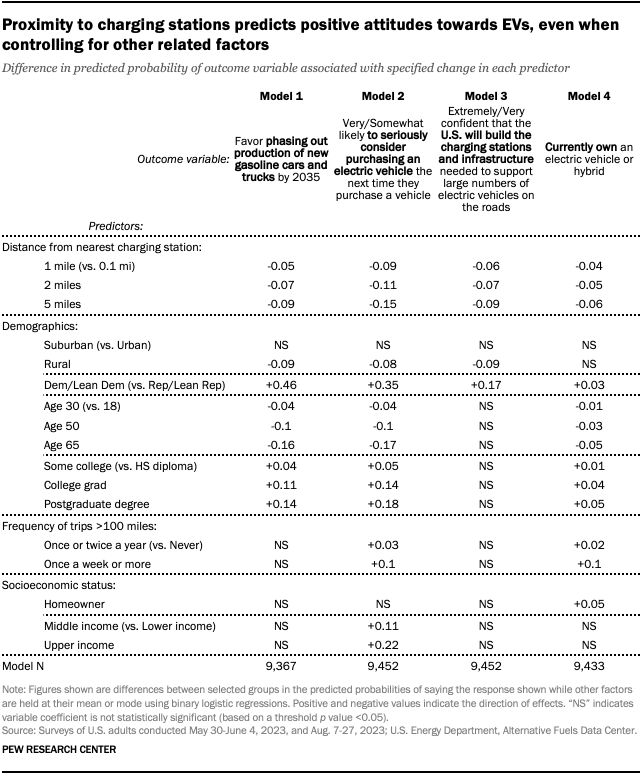
Four binary outcome variables are considered. Model 1 predicts whether respondents favor phasing out production of new gasoline cars and trucks by 2035; Model 2 predicts whether respondents say they are very or somewhat likely to seriously consider purchasing an EV; Model 3 predicts whether respondents say they are extremely or very confident that the U.S. will build the required infrastructure to support large numbers of EVs on the road; and Model 4 predicts whether respondents already own an electric vehicle or hybrid.
The explanatory variables included in each of these models are as follows:
- Distance from nearest charging station: Included in the model as the natural logarithm of the distance from each respondent’s home address to the nearest publicly accessible charging station in miles. In the table of results, distances of 1 mile, 2 miles, and 5 miles are compared against a baseline distance of 0.1 miles.
- Urbanicity: Included in the model as a categorical variable, with suburban and rural against a baseline category of urban.
- Partisan identification: Included in the model as a categorical variable, with Dem/Lean Dem and No lean against a baseline category of Rep/Lean Rep. In the table of results, Dem/Lean Dem is compared against Rep/Lean Rep.
- Age: Included in the model as each respondent’s age in years. In the table of results, ages of 30, 50 and 65 years are compared against a baseline age of 18 years.
- Educational attainment: Included in the model as a numeric scale, ranging from 1 (equivalent to less than a high school diploma) to 6 (equivalent to a postgraduate degree). In the table of results, some college, college degree and postgraduate degree are compared against a baseline of high school graduate.
- Frequency of car trips longer than 100 miles: Included in the model as a numeric scale, ranging from 1 (equivalent to never) to 5 (equivalent to once a week or more). In the table of results, Once or twice a year and once a week or more are compared against a baseline of never.
- Home ownership: Included in the model as a binary variable.
- Income class: Included in the model as a numeric scale, ranging from 1 (equivalent to lower income) to 5 (equivalent to upper income). In the table of results, middle income and upper income are compared against a baseline of lower income.
Each figure in the table shows the difference in predicted probability between two categories or values of an explanatory variable if that variable is a statistically significant predictor of the outcome variable of interest in a given model. For example, in the first column of the table (Model 1), an individual who identifies with or leans toward the Democratic party is 46% more likely than a Republican to favor phasing out production of new gasoline cars and trucks by 2035, holding the other variables at their central tendency (mean or mode, as appropriate). And in the same column (Model 1), someone who lives in a rural area is predicted to be 9% less likely than an urban resident to favor phasing out gas-powered vehicles, again holding the other variables at their respective mean or mode.
The total number of respondents in each analysis ranges between 9,367 and a possible maximum of 10,329 (the total number of respondents who took part in the survey), depending on the number of missing responses to the questions included in the models.
Based on these analyses, proximity to charging infrastructure is a statistically significant predictor of more positive attitudes toward EVs, even when controlling for other factors:
- Those who live closer to charging stations are more in favor of phasing out production of gas-powered vehicles (Model 1). When compared with an individual who lives 0.1 miles from the nearest charger, someone who is 1 mile away is 5% less likely to say they favor phasing out production of new gasoline cars and trucks by 2035; someone 2 miles away is 7% less likely and someone 5 miles away is 9% less likely to say this.
- Those who live closer to charging stations are more likely to consider buying an EV (Model 2). When compared with an individual who lives 0.1 miles from the nearest charger, someone who is 1 mile away is 9% less likely to say they are very or somewhat likely to seriously consider purchasing an electric vehicle the next time they purchase a vehicle; someone 2 miles away is 11% less likely and someone 5 miles away is 15% less likely to say this.
- Those who live closer to charging stations are more confident that the U.S. will build the required infrastructure (Model 3). When compared with an individual who lives 0.1 miles from the nearest charger, someone who is 1 mile away is 6% less likely to say they are extremely or very confident that the U.S. will build the charging stations and infrastructure needed to support large numbers of electric vehicles on the roads; someone 2 miles away is 7% less likely and someone 5 miles away is 9% less likely to say this.
- Those who live closer to charging stations are more likely to already own an electric vehicle or hybrid (Model 4). When compared with an individual who lives 0.1 miles from the nearest charger, someone who is 1 mile away is 4% less likely to already own an electric vehicle or hybrid; someone 2 miles away is 5% less likely and someone 5 miles away is 6% less likely to own one.


