
Automated license plate readers (ALPRs) are high-speed camera systems that automatically photograph every license plate that passes them. When networked together and paired with specialized software, they can reconstruct where a vehicle has been over a period of days or weeks. The technology was initially developed in the United Kingdom in the mid-1970s to aid in terrorism investigations and is now used widely by public safety agencies in the United States.
Flock Safety, founded in 2017, is the leading ALPR vendor. The company estimates that its cameras were used to help with more than 1 million law enforcement investigations in 2025. But there have also been abuses of the company’s technology, including multiple investigations into stalking and misconduct by law enforcement. As a result, some lawmakers in Congress have proposed bills to more tightly regulate ALPRs – or potentially ban them outright.
Here is what we know and don’t know about Flock cameras, based on data from Flock and other sources. In this analysis, the phrase “Flock cameras” specifically refers to the company’s license plate reader technology. We use the phrases “law enforcement agency” and “public safety agency” interchangeably.
How many Flock cameras are out there?
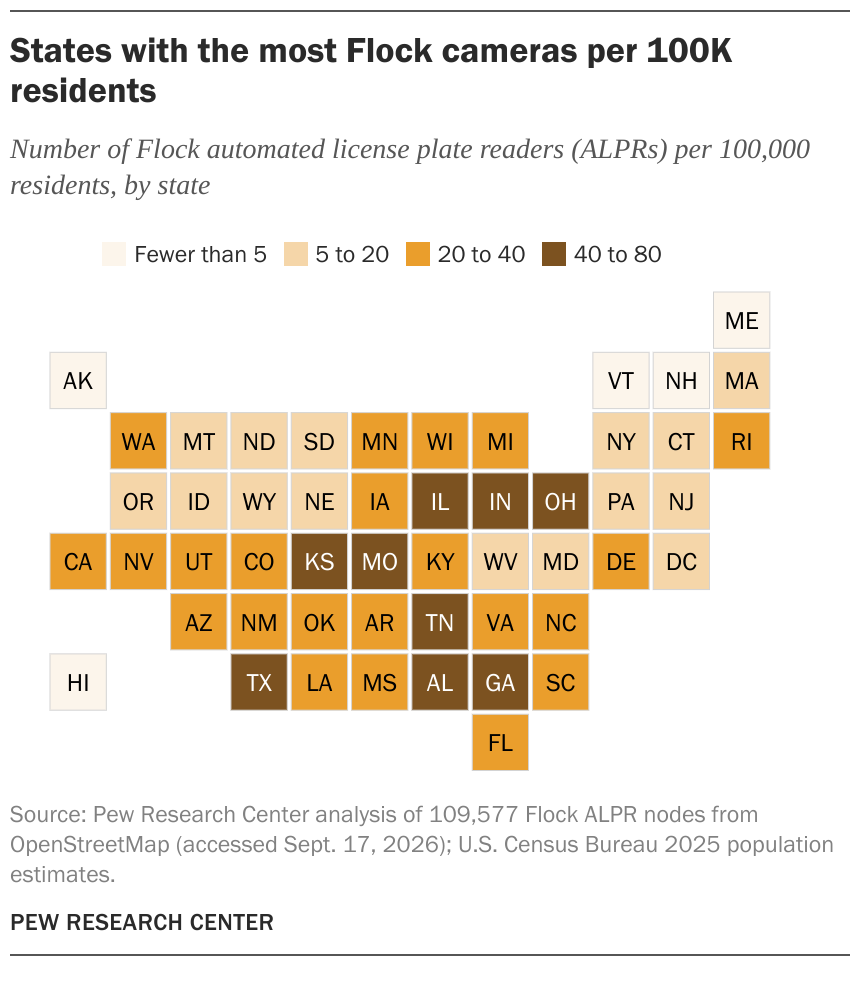
States with the most Flock cameras per 100K residents
Number of Flock automated license plate readers (ALPRs) per 100,000 residents, by state
Source: Pew Research Center analysis of 109,577 Flock ALPR nodes from OpenStreetMap (accessed Sept. 17, 2026); U.S. Census Bureau 2025 population estimates.
PEW RESEARCH CENTER
States with the most Flock cameras per 100K residents
Number of Flock automated license plate readers (ALPRs) per 100,000 residents, by state
| State | FIPS | Number of Flock cameras per 100k residents | camera_count | population |
|---|---|---|---|---|
| Georgia | 13 | 80 | 8944 | 11180878 |
| Ohio | 39 | 51 | 6024 | 11883304 |
| Texas | 48 | 49 | 15318 | 31290831 |
| Indiana | 18 | 48 | 3328 | 6924275 |
| Alabama | 01 | 47 | 2448 | 5157699 |
| Kansas | 20 | 43 | 1272 | 2970606 |
| Tennessee | 47 | 43 | 3083 | 7227750 |
| Illinois | 17 | 42 | 5320 | 12710158 |
| Missouri | 29 | 40 | 2481 | 6245466 |
| California | 06 | 39 | 15450 | 39431263 |
| Colorado | 08 | 36 | 2124 | 5957493 |
| Kentucky | 21 | 35 | 1607 | 4588372 |
| South Carolina | 45 | 35 | 1893 | 5478831 |
| Louisiana | 22 | 34 | 1553 | 4597740 |
| New Mexico | 35 | 33 | 705 | 2130256 |
| Mississippi | 28 | 33 | 968 | 2943045 |
| Florida | 12 | 32 | 7520 | 23372215 |
| Delaware | 10 | 31 | 327 | 1051917 |
| Arkansas | 05 | 31 | 943 | 3088354 |
| North Carolina | 37 | 30 | 3281 | 11046024 |
| Michigan | 26 | 30 | 3001 | 10140459 |
| Arizona | 04 | 29 | 2231 | 7582384 |
| Oklahoma | 40 | 28 | 1133 | 4095393 |
| Virginia | 51 | 28 | 2433 | 8811195 |
| Wisconsin | 55 | 27 | 1618 | 5960975 |
| Rhode Island | 44 | 26 | 294 | 1112308 |
| Washington | 53 | 25 | 1959 | 7958180 |
| Iowa | 19 | 25 | 796 | 3241488 |
| Utah | 49 | 22 | 787 | 3503613 |
| Nevada | 32 | 22 | 725 | 3267467 |
| Minnesota | 27 | 22 | 1249 | 5793151 |
| Nebraska | 31 | 19 | 380 | 2005465 |
| Connecticut | 09 | 17 | 640 | 3675069 |
| Idaho | 16 | 17 | 337 | 2001619 |
| North Dakota | 38 | 15 | 123 | 796568 |
| South Dakota | 46 | 14 | 133 | 924669 |
| Massachusetts | 25 | 14 | 987 | 7136171 |
| District of Columbia | 11 | 13 | 90 | 702250 |
| New Jersey | 34 | 12 | 1151 | 9500851 |
| Maryland | 24 | 11 | 718 | 6263220 |
| Wyoming | 56 | 11 | 66 | 587618 |
| West Virginia | 54 | 11 | 189 | 1769979 |
| Pennsylvania | 42 | 11 | 1389 | 13078751 |
| New York | 36 | 10 | 2033 | 19867248 |
| Oregon | 41 | 8 | 324 | 4272371 |
| Montana | 30 | 5 | 58 | 1137233 |
| Hawaii | 15 | 4 | 65 | 1446146 |
| Maine | 23 | 3 | 46 | 1405012 |
| Vermont | 50 | 3 | 19 | 648493 |
| New Hampshire | 33 | 1 | 13 | 1409032 |
| Alaska | 02 | 0.1 | 1 | 740133 |
Source: Pew Research Center analysis of 109,577 Flock ALPR nodes from OpenStreetMap (accessed Sept. 17, 2026); U.S. Census Bureau 2025 population estimates.
PEW RESEARCH CENTER
There are more than 100,000 Flock cameras in the United States. But the exact number varies from source to source:
- In a statement to The Washington Post in August 2026, Flock claimed that it had over 120,000 cameras in 6,000 communities.
- Volunteer mappers on OpenStreetMap have listed roughly 110,000 Flock license plate readers. These cameras make up about 80% of all the ALPRs on OpenStreetMap.
- The Flock Surveillance Map list, created by a private researcher, has found as many as 175,000 Flock cameras nationwide.
Where are Flock cameras located?
Flock does not publish a list of where its cameras are located, so we used crowdsourced data from OpenStreetMap to see where these cameras are most prevalent.
Around half of all Flock cameras are in just five states. Collectively, California, Texas, Georgia, Florida and Ohio have just over 53,000. That is 49% of all Flock cameras identified on OpenStreetMap.
The states with the most cameras per 100,000 people are Georgia, Ohio and Texas, followed closely by Indiana and Alabama.
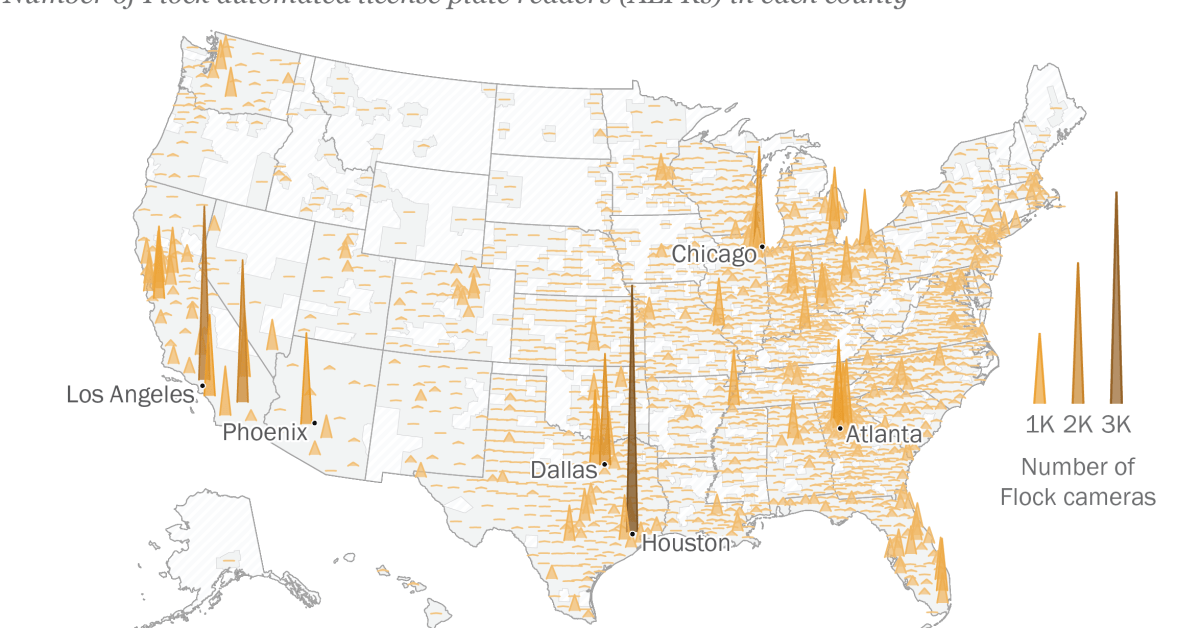
Multiple urban areas have thousands of Flock cameras
Number of Flock automated license plate readers (ALPRs) in each county
Source: Pew Research Center analysis of 109,577 Flock ALPR nodes from OpenStreetMap (accessed Sept. 17, 2026).
PEW RESEARCH CENTER
Multiple urban areas have thousands of Flock cameras
Number of Flock automated license plate readers (ALPRs) in each county
| County | State | County GEOID | Number of Flock cameras |
|---|---|---|---|
| Harris County | Texas | 48201 | 3490 |
| Los Angeles County | California | 06037 | 2457 |
| Riverside County | California | 06065 | 2013 |
| Dallas County | Texas | 48113 | 1572 |
| Cook County | Illinois | 17031 | 1433 |
| Maricopa County | Arizona | 04013 | 1289 |
| Fulton County | Georgia | 13121 | 1244 |
| Orange County | California | 06059 | 1149 |
| Tarrant County | Texas | 48439 | 1054 |
| Santa Clara County | California | 06085 | 1021 |
| San Bernardino County | California | 06071 | 934 |
| DeKalb County | Georgia | 13089 | 902 |
| Gwinnett County | Georgia | 13135 | 899 |
| Wayne County | Michigan | 26163 | 879 |
| Alameda County | California | 06001 | 809 |
| Cuyahoga County | Ohio | 39035 | 788 |
| Shelby County | Tennessee | 47157 | 782 |
| Cobb County | Georgia | 13067 | 759 |
| Broward County | Florida | 12011 | 740 |
| San Diego County | California | 06073 | 695 |
| St. Louis County | Missouri | 29189 | 668 |
| Sacramento County | California | 06067 | 641 |
| Franklin County | Ohio | 39049 | 638 |
| Marion County | Indiana | 18097 | 633 |
| Fort Bend County | Texas | 48157 | 631 |
| Collin County | Texas | 48085 | 608 |
| Jefferson County | Alabama | 01073 | 602 |
| Palm Beach County | Florida | 12099 | 595 |
| Jefferson County | Kentucky | 21111 | 594 |
| Denton County | Texas | 48121 | 583 |
| Hamilton County | Ohio | 39061 | 574 |
| DuPage County | Illinois | 17043 | 566 |
| San Mateo County | California | 06081 | 560 |
| Oakland County | Michigan | 26125 | 509 |
| Contra Costa County | California | 06013 | 507 |
| Bexar County | Texas | 48029 | 502 |
| Sedgwick County | Kansas | 20173 | 468 |
| Travis County | Texas | 48453 | 453 |
| Clark County | Nevada | 32003 | 429 |
| Miami-Dade County | Florida | 12086 | 426 |
| San Francisco County | California | 06075 | 419 |
| Orange County | Florida | 12095 | 417 |
| Yakima County | Washington | 53077 | 410 |
| Will County | Illinois | 17197 | 409 |
| King County | Washington | 53033 | 408 |
| Kern County | California | 06029 | 404 |
| San Joaquin County | California | 06077 | 404 |
| Polk County | Florida | 12105 | 394 |
| Solano County | California | 06095 | 388 |
| Hillsborough County | Florida | 12057 | 383 |
| Mecklenburg County | North Carolina | 37119 | 383 |
| Hennepin County | Minnesota | 27053 | 375 |
| Oklahoma County | Oklahoma | 40109 | 374 |
| Sonoma County | California | 06097 | 357 |
| Arapahoe County | Colorado | 08005 | 348 |
| Lake County | Illinois | 17097 | 348 |
| Volusia County | Florida | 12127 | 343 |
| Montgomery County | Texas | 48339 | 331 |
| Montgomery County | Ohio | 39113 | 330 |
| Pinal County | Arizona | 04021 | 320 |
| Nassau County | New York | 36059 | 315 |
| Wake County | North Carolina | 37183 | 311 |
| Jackson County | Missouri | 29095 | 309 |
| Snohomish County | Washington | 53061 | 306 |
| Bell County | Texas | 48027 | 304 |
| Chatham County | Georgia | 13051 | 298 |
| Lucas County | Ohio | 39095 | 293 |
| Kane County | Illinois | 17089 | 291 |
| Galveston County | Texas | 48167 | 290 |
| Tulsa County | Oklahoma | 40143 | 288 |
| Summit County | Ohio | 39153 | 286 |
| East Baton Rouge Parish | Louisiana | 22033 | 275 |
| Pinellas County | Florida | 12103 | 274 |
| Butler County | Ohio | 39017 | 271 |
| Williamson County | Texas | 48491 | 267 |
| Fairfax County | Virginia | 51059 | 259 |
| Santa Barbara County | California | 06083 | 257 |
| Jefferson Parish | Louisiana | 22051 | 257 |
| Winnebago County | Illinois | 17201 | 256 |
| Salt Lake County | Utah | 49035 | 252 |
| Middlesex County | New Jersey | 34023 | 250 |
| Milwaukee County | Wisconsin | 55079 | 248 |
| Suffolk County | New York | 36103 | 244 |
| Macomb County | Michigan | 26099 | 241 |
| Placer County | California | 06061 | 240 |
| Duval County | Florida | 12031 | 240 |
| Rutherford County | Tennessee | 47149 | 239 |
| Fresno County | California | 06019 | 237 |
| Douglas County | Colorado | 08035 | 234 |
| Genesee County | Michigan | 26049 | 234 |
| St. Johns County | Florida | 12109 | 231 |
| Hidalgo County | Texas | 48215 | 228 |
| Brevard County | Florida | 12009 | 227 |
| Hamilton County | Indiana | 18057 | 226 |
| Providence County | Rhode Island | 44007 | 225 |
| Brazoria County | Texas | 48039 | 225 |
| Richmond County | Georgia | 13245 | 222 |
| Davidson County | Tennessee | 47037 | 222 |
| Cherokee County | Georgia | 13057 | 220 |
| Ventura County | California | 06111 | 218 |
Data table shows the top 100 counties with the most Flock cameras. Click here to download the full data.
Source: Pew Research Center analysis of 109,577 Flock ALPR nodes from OpenStreetMap (accessed Sept. 17, 2026).
PEW RESEARCH CENTER
Download the full county-level data for where Flock cameras are located
These cameras are highly concentrated in urban areas. Roughly 80% of all cameras are in urban areas. The Atlanta and Houston metro areas each contain more than 4,000 Flock cameras, while Los Angeles, Chicago and Dallas-Fort Worth have more than 3,000 apiece.
Flock cameras are also slightly more likely to be in lower-income neighborhoods than higher-income ones. But these differences are relatively modest, and Flock cameras exist in large numbers in communities with varying income levels and racial compositions.
OpenStreetMap shows who owns or operates 12% of these cameras. Most cameras for which this information is available are operated by law enforcement agencies.
How many public safety agencies use Flock cameras?
The main tools for understanding how public safety agencies use Flock cameras are Flock’s transparency portals. These opt-in pages allow agencies to share information with the public about their Flock usage, as well as their policies for things like data sharing and retention.
According to Flock, more than 1,500 agencies maintain a public transparency portal, although the company does not publish the full list. However, the organization EyesOnFlock tracks and compiles the information disclosed on these portals. As of Sept. 21, 2026, the EyesOnFlock database contains 1,517 agencies that have published transparency portals.
All told, these agencies list 39,465 total cameras, which is 36% of all the Flock cameras listed on OpenStreetMaps. But this share varies greatly from state to state.
In states like Virginia and California, the number of cameras listed in these agency transparency portals is very similar to the number listed on OpenStreetMap. But in others, these portals contain just a fraction of the total. For instance, just 6% of cameras listed on OpenStreetMap in Florida are accounted for in a transparency portal. And in Pennsylvania, that share is just 2%. This means that in some states, the vast majority of Flock cameras are officially disclosed as being owned by law enforcement. In others, this type of disclosure is much less common, so their ownership is murkier.
What do these agencies disclose about their Flock usage?
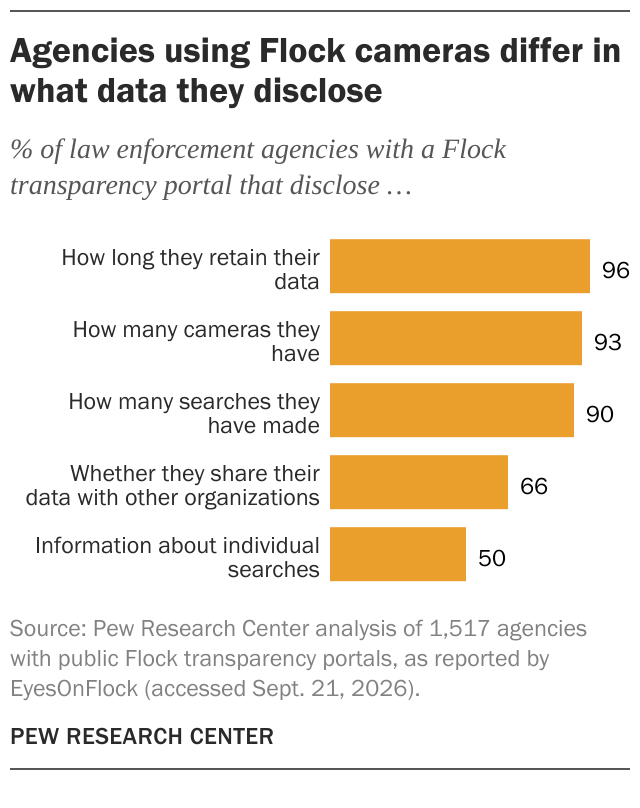
Agencies that choose to publish a Flock transparency portal can also choose what information to disclose. The vast majority of agencies with a transparency portal indicate how many total cameras they have (93%) and how long they retain the data their cameras collect (96%).
Agencies using Flock cameras differ in what data they disclose
% of law enforcement agencies with a Flock transparency portal that disclose …
Source: Pew Research Center analysis of 1,517 agencies with public Flock transparency portals, as reported by EyesOnFlock (accessed Sept. 21, 2026).
PEW RESEARCH CENTER
Agencies using Flock cameras differ in what data they disclose
% of law enforcement agencies with a Flock transparency portal that disclose …
| Field | Percent disclosed |
|---|---|
| How long they retain their data | 96 |
| How many cameras they have | 93 |
| How many searches they have made | 90 |
| Whether they share their data with other organizations | 66 |
| Information about individual searches | 50 |
Source: Pew Research Center analysis of 1,517 agencies with public Flock transparency portals, as reported by EyesOnFlock (accessed Sept. 21, 2026).
PEW RESEARCH CENTER
The median agency with a published transparency portal has 12 Flock cameras and retains its camera data for 30 days. This was the platform’s default data retention period until August of this year, when Flock lowered it to seven days.
About two-thirds of these agencies disclose whether they share the data their cameras collect with other organizations. The agencies that disclose this information reported sharing their data with a median of 217 other organizations – primarily other law enforcement entities.
Some states, like California, limit this type of data sharing. As such, California’s data sharing is largely contained within the state. But in states like Florida and Ohio, law enforcement agencies can share this data across dozens of other states.
Why and how often agencies conduct Flock searches
Through their transparency portals, public safety agencies also sometimes disclose their search activity, including logs of when each search was run and why. About half of the organizations in the EyesOnFlock database share any information about their searches, while the rest do not.
The most common reason given for searches is simply some form of the word “investigation.” This was mentioned in 19% of searches where a reason was added. Flock recently replaced its open-text reason field with a drop-down menu and says it will require a case number on every non-emergency search by the end of the year.
A USA Today investigation published in September requested raw search logs directly from 120 law enforcement agencies across 24 states. Those logs, spanning three-and-a-half years, showed that more than 200,000 users had conducted 75 million searches covering nearly 4 million unique license plates during that time. That’s about 59,000 searches per day.