
The 2026 midterm election is taking place amid deep public dissatisfaction with the state of the nation, near-record low approval ratings of President Donald Trump, and growing negativity about national economic conditions and the ongoing conflict with Iran.
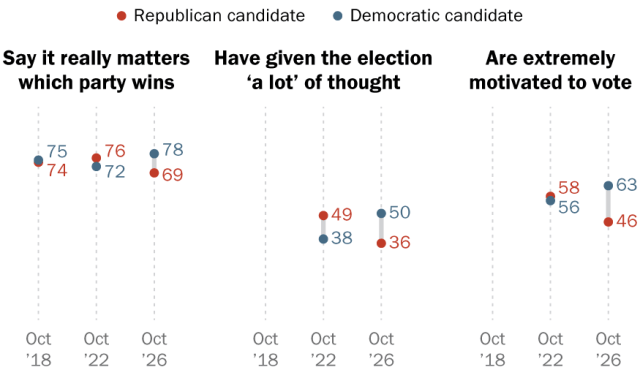
Heading into the midterm home stretch Democratic voters are more invested, motivated than GOP voters
Among registered voters who support the __ for the House of Representatives this November, % who …
Note: Based on registered voters.
Source: Survey of U.S. adults conducted Sept. 28-Oct. 4, 2026.
PEW RESEARCH CENTER
Heading into the midterm home stretch Democratic voters are more invested, motivated than GOP voters
Among registered voters who support the __ for the House of Representatives this November, % who …
| Date | Statement | Rep candidate supporters | Dem candidate supporters |
|---|---|---|---|
| Oct ’18 | It really matters which party wins | 74 | 75 |
| Oct ’22 | It really matters which party wins | 76 | 72 |
| Oct ’26 | It really matters which party wins | 69 | 78 |
| Oct ’18 | They’ve given the election ‘a lot’ of thought | — | — |
| Oct ’22 | They’ve given the election ‘a lot’ of thought | 49 | 38 |
| Oct ’26 | They’ve given the election ‘a lot’ of thought | 36 | 50 |
| Oct ’18 | They’re extremely motivated to vote | — | — |
| Oct ’22 | They’re extremely motivated to vote | 58 | 56 |
| Oct ’26 | They’re extremely motivated to vote | 46 | 63 |
Note: Based on registered voters.
Source: Survey of U.S. adults conducted Sept. 28-Oct. 4, 2026.
PEW RESEARCH CENTER
Against this backdrop, Democratic candidates now hold an 8 percentage point edge over Republican candidates in preferences for the House of Representatives among all registered voters nationally.
And while many registered voters will not turn out to vote this fall, Democratic candidates are also buoyed by their supporters’ relatively high levels of engagement and stated motivation to vote when compared with those who are backing Republican candidates. For example:
- 78% of voters who back their House district’s Democratic candidate say it “really matters” which party wins control of Congress – 9 points higher than the share of Republican backers who say this.
- In contrast, Republican candidate supporters were 4 points higher on this measure than Democratic supporters at a similar point before the 2022 midterm election.
The partisan gap is also wide on other measures of engagement: Democratic supporters are 14 points more likely than Republican supporters to say they have given this year’s election “a lot” of thought and 17 points more likely to say they are “extremely motivated” to vote this year.
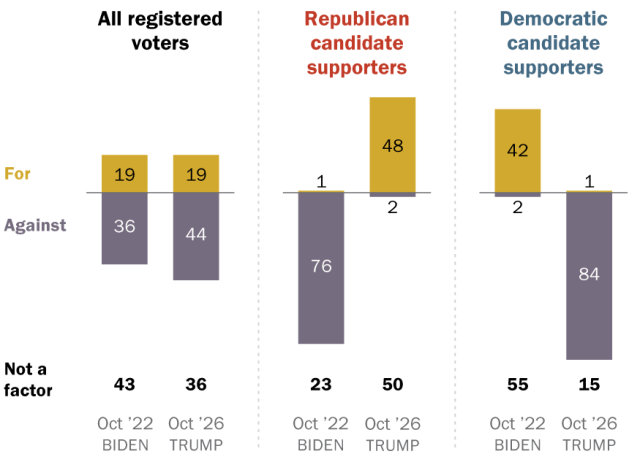
A new Pew Research Center survey of 5,062 U.S. adults – including 3,917 registered voters – conducted Sept. 28-Oct. 4, 2026, also finds that Donald Trump’s approval rating now stands at 30% – the lowest of his second term. Most voters (63%) consider Trump a factor in their vote for Congress, with far more thinking of their choice as a vote against the president (44%) than for him (19%).
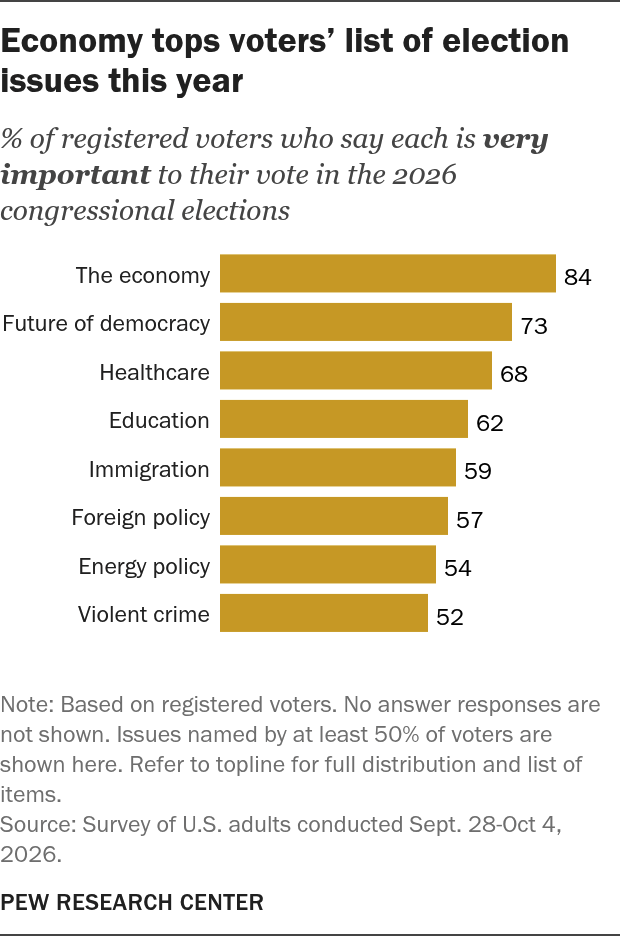
As economic ratings turn more negative and concerns about prices rise – particularly for gas and energy – the economy continues to rank as the top voting issue this year, across the political spectrum: 84% of registered voters – including 88% of those who support Democrats and 82% who back Republicans – say it is very important to their vote.
The midterm race
Democrats currently hold an 8 percentage point edge in national vote preferences, with 44% of all registered voters saying they would support a Democrat for the House if the election were held today and 36% preferring a Republican. Another 5% say they would select a different candidate and 15% say they aren’t sure.
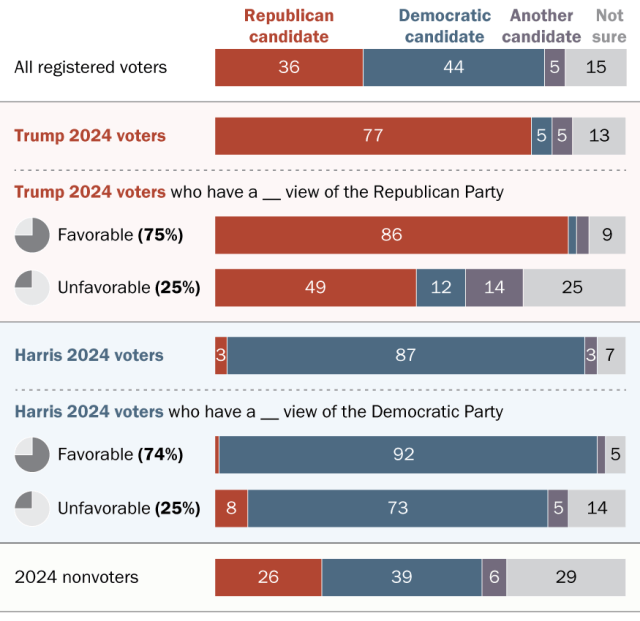
Trump voters who view GOP negatively are less loyal to the party’s midterm candidates than Harris voters with negative views of the Democratic Party
% of registered voters who say that if the election were held today, they would vote for the __ for U.S. House of Representatives in their district
Note: Based on registered voters. Nonvoters include those who did not vote in 2024 but were eligible to do so, as well as those who were not eligible to vote. Validated Trump and Harris voters are adult citizens for whom a record of voting was found in official state election records. Vote choice was collected in a survey conducted in the month after the 2024 election.
Source: Survey of U.S. adults conducted Sept. 28-Oct 4, 2026.
PEW RESEARCH CENTER
Trump voters who view GOP negatively are less loyal to the party’s midterm candidates than Harris voters with negative views of the Democratic Party
% of registered voters who say that if the election were held today, they would vote for the __ for U.S. House of Representatives in their district
| Group | Republican candidate | Democratic candidate | Another candidate | Not sure |
|---|---|---|---|---|
| All registered voters | 36 | 44 | 5 | 15 |
| Trump 2024 voters | 77 | 5 | 5 | 13 |
| Trump 2024 voters who have a favorable opinion of the Republican Party (75% of all Trump 2024 voters) | 86 | 2 | 3 | 9 |
| Trump 2024 voters who have an unfavorable opinion of the Republican Party (25% of all Trump 2024 voters) | 49 | 12 | 14 | 25 |
| Harris 2024 voters | 3 | 87 | 3 | 7 |
| Harris 2024 voters who have a favorable opinion of the Democratic Party (74% of all Harris 2024 voters) | 92 | 1 | 2 | 5 |
| Harris 2024 voters who have an unfavorable opinion of the Democratic Party (25% of all Harris 2024 voters) | 73 | 8 | 5 | 14 |
| 2024 nonvoters | 26 | 39 | 6 | 29 |
Note: Based on registered voters. Nonvoters include those who did not vote in 2024 but were eligible to do so, as well as those who were not eligible to vote. Validated Trump and Harris voters are adult citizens for whom a record of voting was found in official state election records. Vote choice was collected in a survey conducted in the month after the 2024 election.
Source: Survey of U.S. adults conducted Sept. 28-Oct 4, 2026.
PEW RESEARCH CENTER
Among validated voters – confirmed to have voted in the 2024 election – those who voted for Trump are less consolidated behind GOP candidates (77%) than Kamala Harris’ voters are behind Democratic candidates (87%).
The difference is even more pronounced among voters who are disaffected with the party they backed in 2024 – who make up a quarter of each 2024 coalition:
- 49% of Trump voters who have an unfavorable view of the GOP today support Republican candidates for the House this year. While only 12% say they back Democrats, more than a third say either that they are “not sure” (25%) or prefer “another candidate” (14%).
- In contrast, Harris voters with a negative view of the Democratic Party are much more solid in their preferences for Democrats this year: 73% say they support Democratic House candidates.
In both 2024 coalitions, these disaffected voters are less engaged with the election than those who have positive views of the parties – but that is particularly the case among Trump’s 2024 voters. For instance, just 36% of Trump voters with an unfavorable view of the GOP say the outcome this November really matters. By comparison, 65% of Harris voters with a negative view of the Democratic Party say it does.
For more on demographic differences in candidate support, jump to “Midterm Vote Preferences by Race and Ethnicity, Age and Other Demographics” and explore the detailed tables.
Trump’s approval rating continues to drop
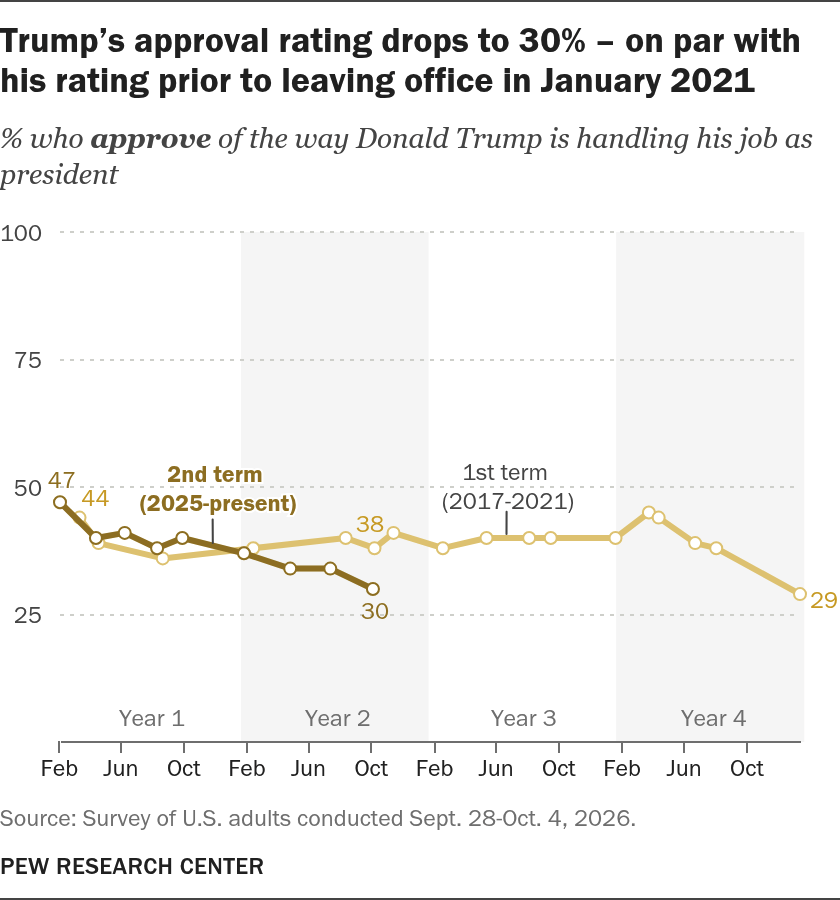
Three-in-ten Americans now say they approve of Trump’s handling of his job as president, while 68% disapprove – down 4 percentage points from July and his lowest approval rating of his second term.
Trump’s approval rating drops to 30% – on par with his rating prior to leaving office in January 2021
% who approve of the way Donald Trump is handling his job as president
Source: Survey of U.S. adults conducted Sept. 28-Oct. 4, 2026.
PEW RESEARCH CENTER
Trump’s approval rating drops to 30% – on par with his rating prior to leaving office in January 2021
% who approve of the way Donald Trump is handling his job as president
| Date to plot | Year | Date | 1st term (2017-2021) | 2nd term (2025-present) |
|---|---|---|---|---|
| 2017-02-02 | 1 | Feb 2 | — | 47 |
| 2017-03-12 | 1 | Mar 12 | 44 | — |
| 2017-04-13 | 1 | Apr 13 | — | 40 |
| 2017-04-18 | 1 | Apr 18 | 39 | — |
| 2017-06-08 | 1 | Jun 8 | — | 41 |
| 2017-08-10 | 1 | Aug 10 | — | 38 |
| 2017-08-21 | 1 | Aug 21 | 36 | — |
| 2017-09-28 | 1 | Sep 28 | — | 40 |
| 2018-01-26 | 2 | Jan 26 | — | 37 |
| 2018-02-13 | 2 | Feb 13 | 38 | — |
| 2018-04-26 | 2 | Apr 26 | — | 34 |
| 2018-07-13 | 2 | Jul 13 | — | 34 |
| 2018-08-12 | 2 | Aug 12 | 40 | — |
| 2018-10-04 | 2 | Oct 4 | — | 30 |
| 2018-10-07 | 2 | Oct 7 | 38 | — |
| 2018-11-13 | 2 | Nov 13 | 41 | — |
| 2019-02-17 | 3 | Feb 17 | 38 | — |
| 2019-05-13 | 3 | May 13 | 40 | — |
| 2019-08-04 | 3 | Aug 4 | 40 | — |
| 2019-09-15 | 3 | Sep 15 | 40 | — |
| 2020-01-19 | 4 | Jan 19 | 40 | — |
| 2020-03-24 | 4 | Mar 24 | 45 | — |
| 2020-04-12 | 4 | Apr 12 | 44 | — |
| 2020-06-22 | 4 | Jun 22 | 39 | — |
| 2020-08-02 | 4 | Aug 2 | 38 | — |
| 2021-01-12 | 4 | Jan 12 | 29 | — |
Source: Survey of U.S. adults conducted Sept. 28-Oct. 4, 2026.
PEW RESEARCH CENTER
Much of this decline in his approval ratings over the course of his term is among Trump’s own 2024 voters – 67% of validated Trump 2024 voters approve of his job performance today while 31% disapprove. At the beginning of his term, 95% approved.
Some of the starkest declines have come among Hispanic and younger voters who backed Trump in 2024.
For more on Trump’s approval ratings and confidence in his governing and handling of issues, read “Trump’s Approval Rating Drops as Fewer Americans Are Confident in His Handling of the Economy, Other Issues.”
Most Democratic supporters view their vote as being against Trump; about half of Republicans say their vote is for him
% of registered voters who think about their vote for Congress this fall as a vote __ the president
Note: Based on registered voters. No answer responses are not shown.
Source: Survey of U.S. adults conducted Sept. 28-Oct. 4, 2026.
PEW RESEARCH CENTER
Most Democratic supporters view their vote as being against Trump; about half of Republicans say their vote is for him
% of registered voters who think about their vote for Congress this fall as a vote __ the president
| Group | Date | For | Against | Not a factor |
|---|---|---|---|---|
| All RVs | Oct 2022 Biden | 19 | 36 | 43 |
| All RVs | Oct 2026 Trump | 19 | 44 | 36 |
| Republican candidate supporters | Oct 2022 Biden | 1 | 76 | 23 |
| Republican candidate supporters | Oct 2026 Trump | 48 | 2 | 50 |
| Democratic candidate supporters | Oct 2022 Biden | 36 | 4 | 60 |
| Democratic candidate supporters | Oct 2026 Trump | 1 | 84 | 15 |
Note: Based on registered voters. No answer responses are not shown.
Source: Survey of U.S. adults conducted Sept. 28-Oct. 4, 2026.
PEW RESEARCH CENTER
Trump is more of a factor in voters’ choices this year than Joe Biden was four years ago. While voters in most recent midterms have tended to be motivated more by opposition to the sitting president than support for him, the current gap is wider than it was four years ago – when 36% of voters saw their vote in opposition to Biden and 19% viewed it as in support of him.
Other key findings
Satisfaction with the state of the nation has dropped to 39% among Republicans overall (including those who lean to the GOP). This is the lowest of Trump’s second term (down from 65% shortly after he entered office and 54% at the beginning of this year). Overall, 22% of Americans say they are satisfied with the state of the nation, while 77% are dissatisfied.
Majorities of voters consider the future of democracy (73%), healthcare (68%), education (62%), immigration (59%) and foreign policy (57%) as important to their vote. As in past elections, immigration is a more central issue for Republican voters (72% say it’s very important) than for Democratic voters (53%) – but Democratic voters see it as a more important issue than they did four years ago. For more on the top issues in the election, read “Economy ranks as top issue in midterms for all voters – but partisans differ over the importance of other issues.”
Economy tops voters’ list of election issues this year
% of registered voters who say each is very important to their vote in the 2026 congressional elections
Note: Based on registered voters. No answer responses are not shown. Issues named by at least 50% of voters are shown here. Refer to topline for full distribution and list of items.
Source: Survey of U.S. adults conducted Sept. 28-Oct 4, 2026.
PEW RESEARCH CENTER
Economy tops voters’ list of election issues this year
% of registered voters who say each is very important to their vote in the 2026 congressional elections
| Issue | All RVs |
|---|---|
| The economy | 84 |
| Future of democracy | 73 |
| Healthcare | 68 |
| Education | 62 |
| Immigration | 59 |
| Foreign policy | 57 |
| Energy policy | 54 |
| Violent crime | 52 |
Note: Based on registered voters. No answer responses are not shown. Issues named by at least 50% of voters are shown here. Refer to topline for full distribution and list of items.
Source: Survey of U.S. adults conducted Sept. 28-Oct 4, 2026.
PEW RESEARCH CENTER
Related: Cost Concerns Dominate as Public’s Economic Ratings Turn More Negative
The U.S. military action in Iran remains deeply unpopular, and most Americans think it won’t end soon. A third of Americans approve of how Trump is handling the conflict – down from 37% in March, shortly after it began. About three-quarters of Americans (77%) expect the conflict to last another six months or more.
Most voters (61%) say they dislike elected officials who support building data centers in their area; just 8% like this. While dislike is especially widespread among Democratic voters (75% dislike), on balance Republican voters also do not like leaders who support data centers (44% dislike, 14% like).
Related: Americans’ Views of Data Centers Have Turned More Negative