Pew Knight Initiative
The Pew-Knight Initiative supports new research on how Americans absorb civic information, form beliefs and identities, and engage in their communities.
Pew Research Center is a nonpartisan, nonadvocacy fact tank that informs the public about the issues, attitudes and trends shaping the world. Knight Foundation is a social investor committed to supporting informed and engaged communities. Learn more >
Urban, suburban and rural Americans engage with their communities at broadly similar rates. But they differ in some of the specific activities they do, from how they participate in politics to whether they are more likely to meet with people online or offline.
This data comes from a recent study from the Pew-Knight Initiative about how Americans engage with politics, civic life, religion and news. Pew Research Center sorted adults into four groups that reflect different patterns of participation: Mobilizers, Connectors, Spectators and Outsiders.
Americans in urban, suburban, and rural communities engage in society in slightly different ways
% of U.S. adults in each engagement group, by community type
Note: We sorted Americans into four “engagement groups” based on their responses to 19 questions about political activity, civic involvement, religious attendance and attention to news. Respondents who were not categorized into an engagement group are not shown.
Source: Pew Research Center survey of U.S. adults conducted Sept. 8-14, 2025.
PEW-KNIGHT INITIATIVE
Americans in urban, suburban, and rural communities engage in society in slightly different ways
% of U.S. adults in each engagement group, by community type
| Community type | Mobilizers | Connectors | Spectators | Outsiders |
|---|---|---|---|---|
| Urban | 9 | 23 | 33 | 35 |
| Suburban | 9 | 34 | 27 | 30 |
| Rural | 10 | 30 | 25 | 35 |
Note: We sorted Americans into four “engagement groups” based on their responses to 19 questions about political activity, civic involvement, religious attendance and attention to news. Respondents who were not categorized into an engagement group are not shown.
Source: Pew Research Center survey of U.S. adults conducted Sept. 8-14, 2025.
PEW-KNIGHT INITIATIVE
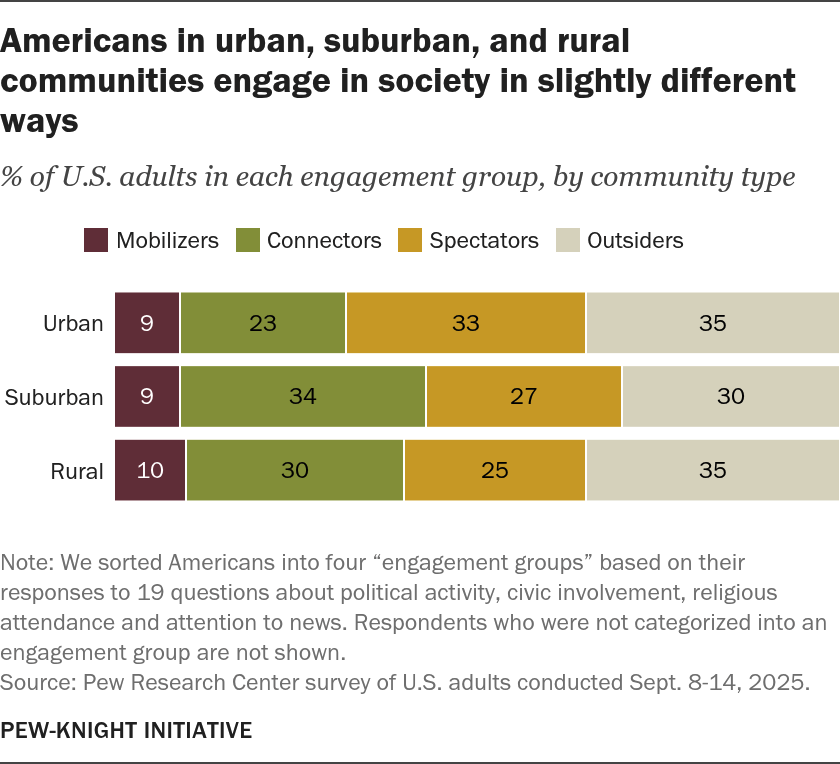
Suburban residents are somewhat more likely than urban or rural residents to be classified as Connectors – the type of people who tend to be engaged in their community by volunteering, donating and participating in groups or clubs, but who are less engaged in political action. Urban Americans, meanwhile, are more likely than suburban or rural Americans to be Spectators – the group engaged mainly as news consumers rather than as active participants.
Mobilizers – the small share of Americans who are highly active across nearly every measure of civic, political, news and religious engagement in this analysis – make up about the same share of urban (9%), suburban (9%) and rural (10%) Americans. Similarly, Outsiders, who are the least engaged in civic and political life, make up roughly a third of Americans in each setting (35% of urban residents, 30% of suburban residents and 35% of rural residents).
Differences between Americans living in cities, the suburbs and rural areas are often small in survey research. People of all ages, incomes, races, ethnicities and political identities live in all three types of places, and these traits often predict how people think or behave better than community type does. But along with the differences by engagement group, there are a few specific ways people in various types of communities engage in civic life differently.
About the engagement groups
 Mobilizers: Doing it all. This group is the smallest and the most active across politics, civics, news and religion.
 Connectors: Involved, but less political. This group is larger than the Mobilizers and also highly engaged in many ways – including joining groups and making donations – but much less likely than the Mobilizers to be heavily involved in political activities.
 Spectators: Keeping an eye on things. They follow the news at high rates but are much less likely than the more engaged groups to participate directly in other ways.
 Outsiders: Less involved in most ways. This group is less likely than others to report taking part in most of the activities we asked about – including voting, volunteering and following the news.
Read more about the study and the engagement groups.
Social and religious engagement
Some Americans are more likely than others to volunteer, join a group or attend religious services
% of U.S. adults who live in each area and …
Source: Pew Research Center survey of U.S. adults conducted Sept. 8-14, 2025.
PEW-KNIGHT INITIATIVE
Some Americans are more likely than others to volunteer, join a group or attend religious services
% of U.S. adults who live in each area and …
| Activity | Urban | Suburban | Rural |
|---|---|---|---|
| Volunteered in the past year | 26 | 31 | 26 |
| Were part of a group or organization in the past year | 30 | 37 | 33 |
| Attend religious services (in person or online) at least monthly | 33 | 37 | 42 |
Source: Pew Research Center survey of U.S. adults conducted Sept. 8-14, 2025.
PEW-KNIGHT INITIATIVE
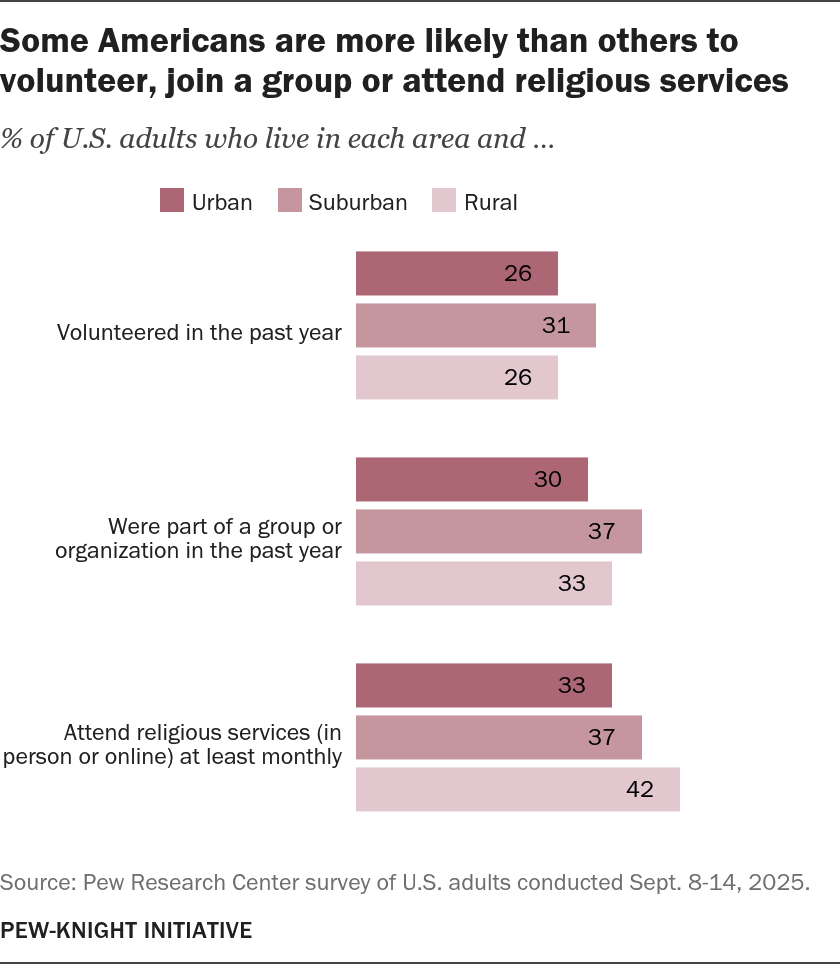
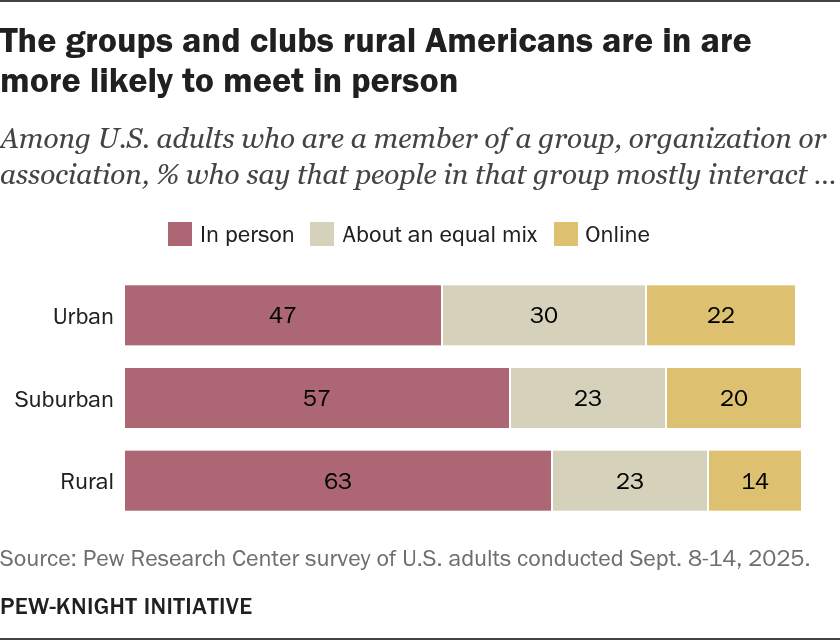
Suburban Americans are slightly more likely than those living in urban or rural areas to have volunteered in the past year and to be a part of a group or organization. But the groups rural Americans belong to are more likely than urban Americans’ groups to interact mostly in person, rather than mostly online or through an equal mix of the two. And urban Americans are more likely than rural Americans to say their groups meet mostly online.
(Even though rural residents are slightly older than urban residents, these differences persist across age groups.)
The groups and clubs rural Americans are in are more likely to meet in person
Among U.S. adults who are a member of a group, organization or association, % who say that people in that group mostly interact …
Source: Pew Research Center survey of U.S. adults conducted Sept. 8-14, 2025.
PEW-KNIGHT INITIATIVE
The groups and clubs rural Americans are in are more likely to meet in person
Among U.S. adults who are a member of a group, organization or association, % who say that people in that group mostly interact …
| Community type | In person | About an equal mix | Online |
|---|---|---|---|
| Urban | 47 | 30 | 22 |
| Suburban | 57 | 23 | 20 |
| Rural | 63 | 23 | 14 |
Source: Pew Research Center survey of U.S. adults conducted Sept. 8-14, 2025.
PEW-KNIGHT INITIATIVE
Rural Americans are more religious overall than those who live in cities and suburbs, so it’s not surprising that they also tend to be more religiously engaged. They are more likely to attend religious services, whether in person or online: 42% of rural Americans say they do this at least monthly, compared with 37% of those in suburban areas and 33% of those in urban areas. Rural Americans are also more likely to say they pray several times a day.
Political engagement
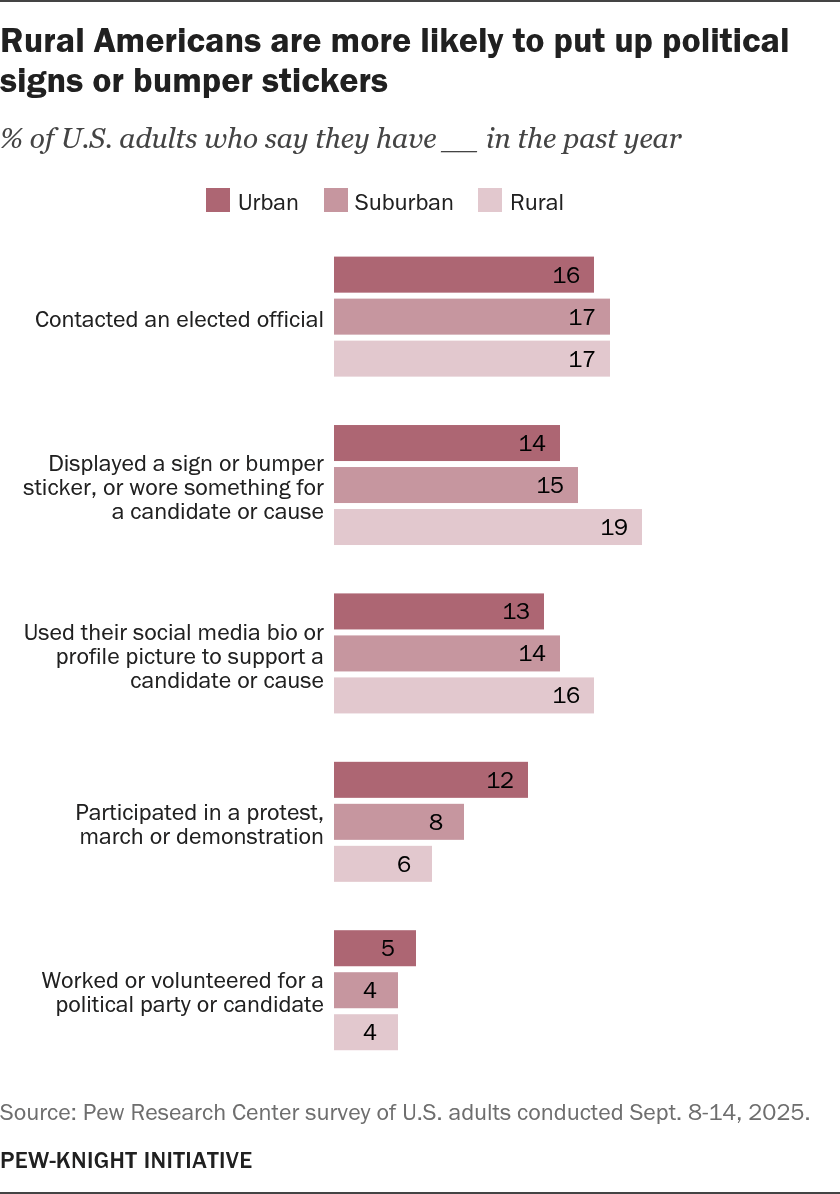
Americans in urban, suburban and rural areas are about equally likely to be politically active. About a third in each group have taken at least one of five political actions we asked about. But the likelihood of taking specific actions differs depending on where they live.
Rural Americans are more likely to put up political signs or bumper stickers
% of U.S. adults who say they have __ in the past year
Source: Pew Research Center survey of U.S. adults conducted Sept. 8-14, 2025.
PEW-KNIGHT INITIATIVE
Rural Americans are more likely to put up political signs or bumper stickers
% of U.S. adults who say they have __ in the past year
| Activity | Urban | Suburban | Rural |
|---|---|---|---|
| Contacted an elected official | 16 | 17 | 17 |
| Displayed a sign or bumper sticker, or wore something for a candidate or cause | 14 | 15 | 19 |
| Used their social media bio or profile picture to support a candidate or cause | 13 | 14 | 16 |
| Participated in a protest, march or demonstration | 12 | 8 | 6 |
| Worked or volunteered for a political party or candidate | 5 | 4 | 4 |
Source: Pew Research Center survey of U.S. adults conducted Sept. 8-14, 2025.
PEW-KNIGHT INITIATIVE
People in rural areas are more likely than those in urban areas to display signs or bumper stickers, regardless of party.
Americans living in urban areas, on the other hand, were more likely to have attended a march or protest in the year leading up to our survey. This is because more Democrats live in urban areas, and Democrats were more likely to have taken part in a march or protest than Republicans during that time period. The survey was fielded in September 2025, a few months after several “No Kings” protests against the Trump administration took place around the country.
Note: Here are the survey questions used for this analysis, the detailed responses and the methodology.