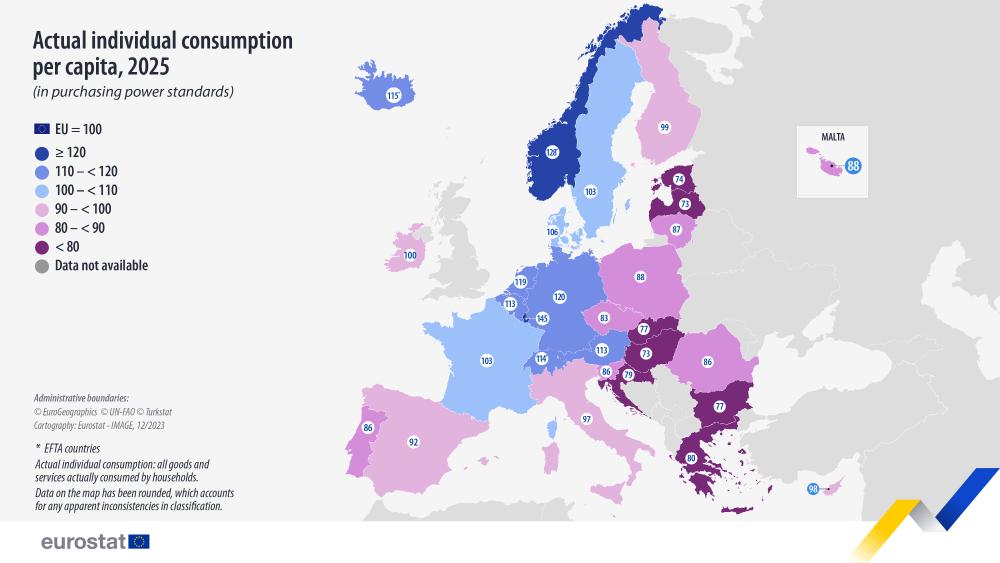
In 2025, actual individual consumption (AIC) per capita expressed in purchasing power standard (PPS) varied from 73% to 145% of the EU average across the 27 EU countries.
This information comes from recently published data on purchasing power parities (PPPs). This article presents a handful of the findings from the more detailed account in the Statistics Explained article on consumption and GDP per capita.
Source dataset: prc_ppp_ind_1
8 EU countries recorded an AIC per capita above the EU average. The highest levels were recorded in Luxembourg (45% above the EU average), Germany (20%) and the Netherlands (19%).
The remaining 19 EU countries fell below the EU average, with the lowest levels recorded in Hungary and Latvia (27% below the EU average) and Estonia (26%).
Large differences in GDP per capita
Gross domestic product (GDP) per capita, a measure of economic activity, also showed substantial differences across the EU. 10 EU countries recorded GDP per capita above the EU average, with the highest levels in Luxembourg (139% above the EU average), Ireland (138%) and the Netherlands (33%). At the other end of the range, the lowest GDP per capita was recorded in Greece and Bulgaria (32% below the EU average), followed by Latvia (29%).

Source dataset: prc_ppp_ind_1