Americans are evenly divided in their preferences for the size of government. Yet a somewhat greater share wants the government to do more to solve problems than say it is doing too much better left to others.
There is a persistent belief that government is wasteful: 56% say it is “almost always wasteful and inefficient.”
However, a majority of Americans (58%) say government regulation of business is necessary to protect the public good.
Divisions on government’s size, scope
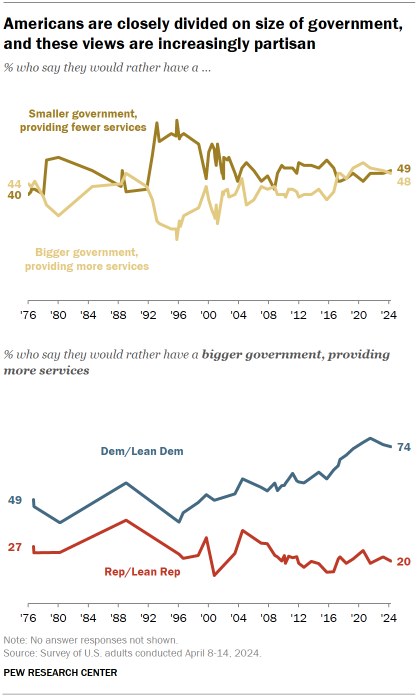
Overall, 49% say they would prefer a smaller government providing fewer services, while 48% say they would rather have a bigger government providing more services.
Most Democrats prefer a larger government. For nearly half a century, Democrats and Republicans have differed in their preferences for the size of government. Today, those differences are as wide as they have ever been:
- Nearly three-quarters of Democrats and Democratic-leaning independents (74%) favor a bigger government, providing more services. By comparison, in 2015, a smaller majority of Democrats (59%) said they preferred a bigger government.
- Just 20% of Republicans and Republican leaners prefer a bigger government; nearly four times as many want smaller government with fewer services. Republicans’ views of the size of government have changed less than Democrats’. Still, when George W. Bush was running for reelection in 2004, roughly a third of Republicans favored a bigger government.
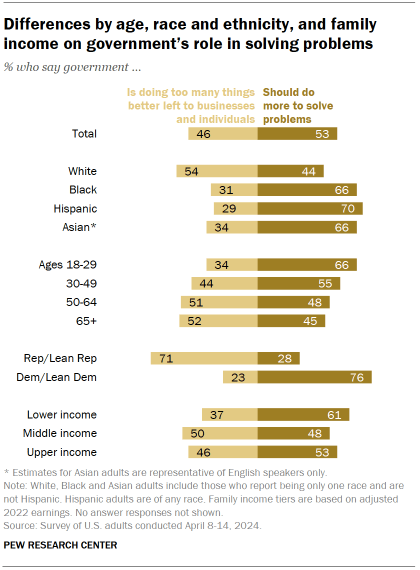
When asked about the proper role of government, about half of Americans (53%) say the government should do more to solve problems, while 46% say the government is doing too many things better left to businesses and individuals.
An overwhelming share of Democrats (76%) say government should do more to solve problems, while about a quarter (23%) say it is doing too many things better left to individuals and businesses.
By contrast, Republicans prefer a more limited role for government: 71% say government is doing too many things better left to businesses and individuals, while 28% say government should do more to solve problems.
There are also sizable demographic differences in these views:
- White adults (54%) are the most likely to say government is doing too many things better left to businesses and individuals, while smaller shares of Asian (34%), Black (31%) and Hispanic (29%) adults say the same.
- Younger adults are more likely than older adults to favor a larger role for government, with adults ages 18 to 29 (66%) being the most likely to say government should do more to solve problems.
- Among income groups, a majority of lower-income adults (61%) say government should do more to solve problems, while smaller shares of upper- and middle-income adults (53% and 48%, respectively) say the same.
Views among partisans by race, ethnicity and income
Among partisans, there are wide demographic differences on the preferred role of government – especially among Republicans.
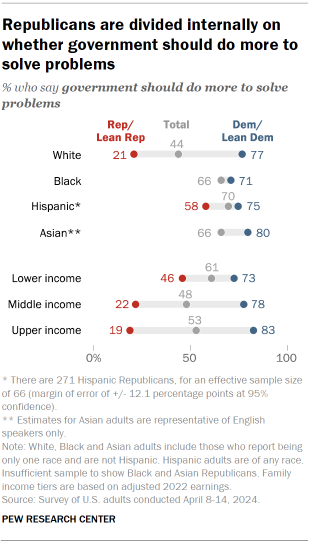
Hispanic Republicans (58%) are much more likely than White Republicans (21%) to favor a larger role for government.
Views among Democrats are much less divided, with at least seven-in-ten Democrats in each racial and ethnic group saying government should do more to solve problems.
Nearly half of lower-income Republicans (46%) say that the government should do more to solve problems, while smaller shares of middle- (22%) and upper-income (19%) Republicans say the same.
Wide majorities of Democrats across income groups say government should do more to solve problems.
Views on the efficiency of government
In assessments of the efficiency of the government, a majority of Americans (56%) find it to be “almost always wasteful and inefficient.” A smaller share (42%) say government “often does a better job than people give it credit for.”
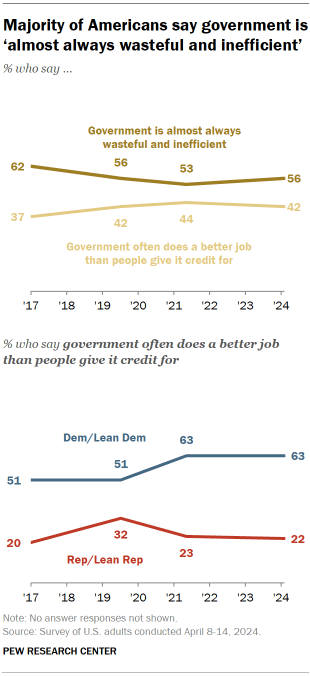
Overall, views on the efficiency of government have remained somewhat steady since 2019, with views today mirroring those five years ago.
Among partisans, a majority of Democrats (63%) say the government often does a better job than people give it credit for, while a large majority of Republicans (77%) say government is often wasteful and inefficient.
Views on the efficiency of government in both parties have remained steady since 2021.
While Democrats are generally more likely than Republicans to say government does not get enough credit, these views vary somewhat depending on which party holds the presidency:
- Democrats are now more likely to give credit to the government than they were during the Trump administration.
- Among Republicans, views of government efficiency were more positive during the Trump administration.
This is consistent with shifts in views during prior administrations.
Views on the government’s regulation of business
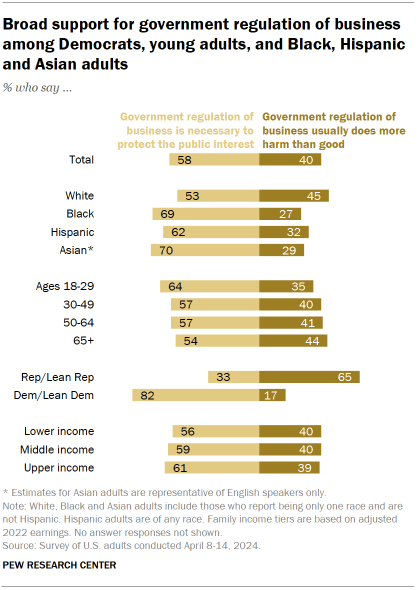
On the topic of government regulation of business, about six-in-ten Americans (58%) say that government regulation of business is necessary to protect the public interest. Four-in-ten, however, say government regulation of business usually does more harm than good.
These views have remained largely unchanged since 2017.
As with other attitudes about government, Republicans and Democrats differ on the impact of government regulation of business:
- About two-thirds of Republicans (65%) say government regulation does more harm than good.
- Roughly eight-in-ten Democrats (82%) say government regulation is necessary to protect the public interest.
Among other demographic differences:
- White adults (45%) are the most likely to say government regulation does more harm than good, while smaller shares of Hispanic (32%), Asian (29%) and Black (27%) adults say the same.
- Younger adults are more likely than older adults to say government regulation of business is necessary to protect the public interest, with adults ages 18 to 29 (64%) being the most likely to say this.
Confidence in the nation’s ability to solve problems
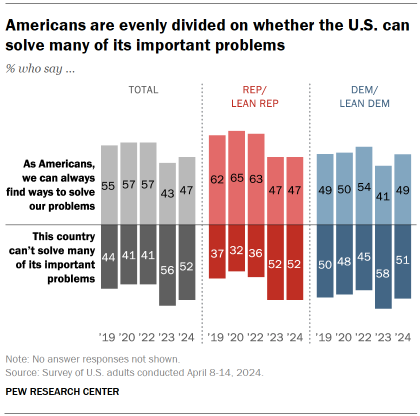
Americans are divided in their views on the country’s ability to solve important problems. About half (52%) of Americans say “this country can’t solve many of its important problems,” while 47% say that “as Americans, we can always find ways to solve our problems and get what we want.”
More Americans express confidence in the country’s ability to solve problems now than a year ago (47% now, 43% then). Still, the share saying this is lower than it was from 2019 to 2022.
Unlike assessments of government, there are no partisan differences in views on the country’s ability to solve its important problems.
In both parties, about half say the U.S. can’t solve many of its important problems, while slightly narrower shares say Americans can always find ways to solve the country’s problems.
Views among age groups
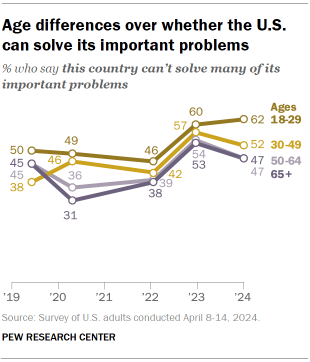
Among age groups, younger adults are the most likely to express skepticism in the country’s ability to solve its important problems. About six-in-ten adults ages 18 to 29 (62%) say the U.S. can’t solve many of its important problems, while smaller shares of older adults say the same.
Overall, the shares of adults in each age group who voice skepticism on the country’s ability to solve its problems remain higher than they were in 2022.
However, older adults have grown slightly more optimistic on this issue in the past year. Views among the youngest adults are relatively unchanged from 2022.