
A Pew Research Center survey from this spring found that, while relatively small shares of U.S. workers say they are highly satisfied with their pay and opportunities for promotion, most are highly satisfied with their relationship with their manager or supervisor.
Pew Research Center conducted this analysis to explore U.S. workers’ views of their managers or supervisors. This analysis is based on survey responses from 2,657 employed U.S. adults who have a manager or supervisor at work. Workers were asked to rate their boss overall and along a series of leadership dimensions and traits before the survey asked about their boss’s gender and race and ethnicity.
Their responses were part of a larger survey of U.S. adults conducted July 17-23, 2023.
Everyone who took part in the survey is a member of the Center’s American Trends Panel (ATP), an online survey panel that is recruited through national, random sampling of residential addresses. Address-based sampling ensures that nearly all U.S. adults have a chance of selection. The survey is weighted to be representative of the U.S. adult population by gender, race, ethnicity, partisan affiliation, education and other categories. Read more about the ATP’s methodology.
Here are the questions used for this analysis, along with responses, and the survey methodology.
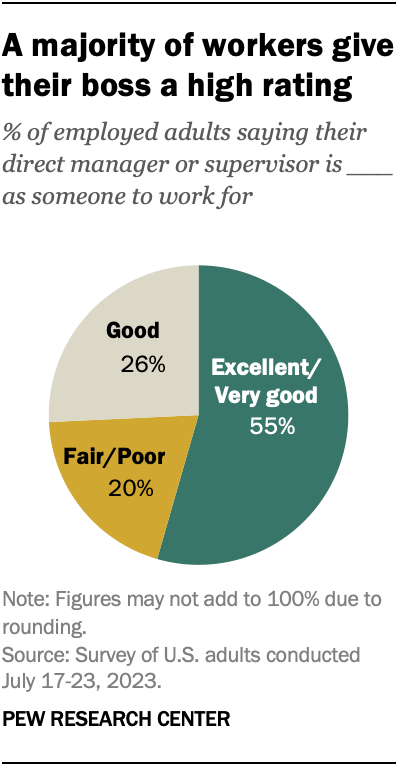
We dug deeper into how Americans feel about their bosses in a July survey. We found that a majority of workers (55%) say their manager or supervisor is excellent or very good to work for.
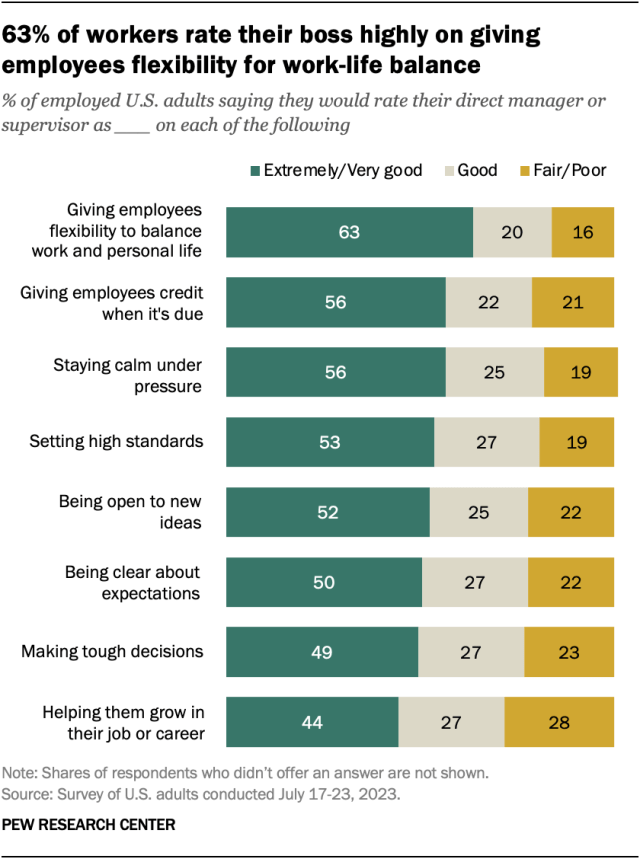
About half or more rate their boss highly on leadership dimensions such as giving employees flexibility to balance work and personal life and staying calm under pressure. Majorities also describe their boss as capable, confident and fair.
Notably, these assessments don’t vary depending on whether the boss is a man or a woman. And most workers do not have a preference when it comes to their boss’s gender.
What workers think bosses do well
About half or more workers say their direct manager or supervisor is excellent or very good when it comes to:
- Giving employees flexibility to balance work and their personal life (63%)
- Giving employees credit when it’s due (56%)
- Staying calm under pressure (56%)
- Setting high standards (53%)
- Being open to new ideas (52%)
- Being clear about expectations (50%)
- Making tough decisions (49%)
A smaller share (44%) say their boss is at least very good at helping them grow in their job or career.
For the most part, workers don’t rate their boss differently based on their boss’s gender. But workers with a supervisor who is a woman are somewhat more likely than those whose supervisor is a man to say their boss is excellent or very good at giving employees credit (59% vs. 54%).
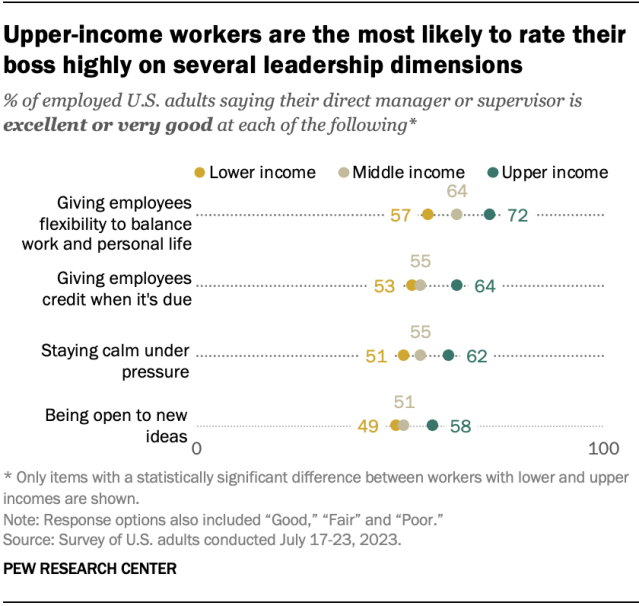
Workers with upper incomes are more likely than those with middle and lower incomes to say their bosses are excellent or very good across several of these leadership dimensions.
Traits workers see in their bosses
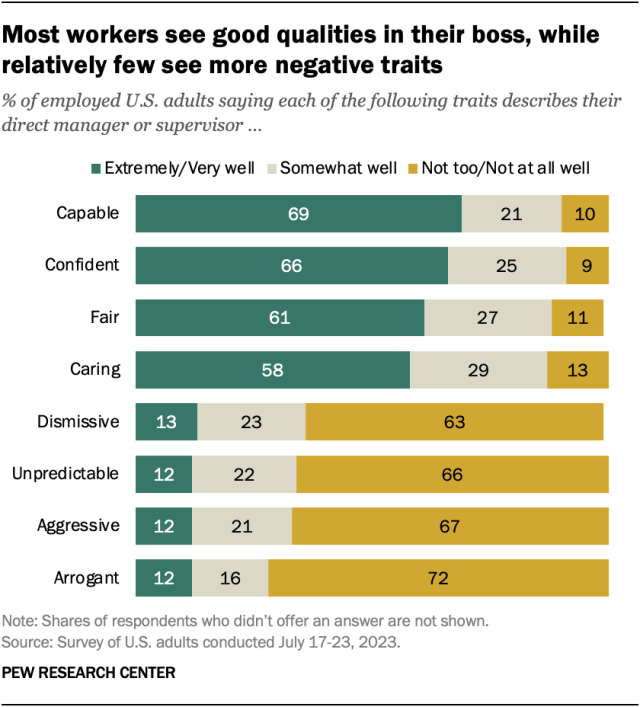
More than half of workers say their boss displays positive traits such as being capable (69%), confident (66%), fair (61%) and caring (58%). In contrast, fewer than one-in-five workers say negative traits such as being dismissive, unpredictable, aggressive or arrogant describe their boss.
There are no consistent differences in these views by workers’ income.
For the most part, views don’t change based on the boss’s gender. But workers with a supervisor who is a woman are more likely than those whose supervisor is a man to describe their boss as caring (63% vs. 55%).
The survey also asked workers about their boss’s race and ethnicity. There were no consistent differences in how people describe White, Black and Hispanic bosses. (There weren’t enough workers with Asian bosses to analyze their responses separately.)
Would Americans rather work for a man or a woman?
We also asked U.S. workers whether they would prefer a direct manager or supervisor who was a man, a woman or someone who identifies another way if they were taking a new job.
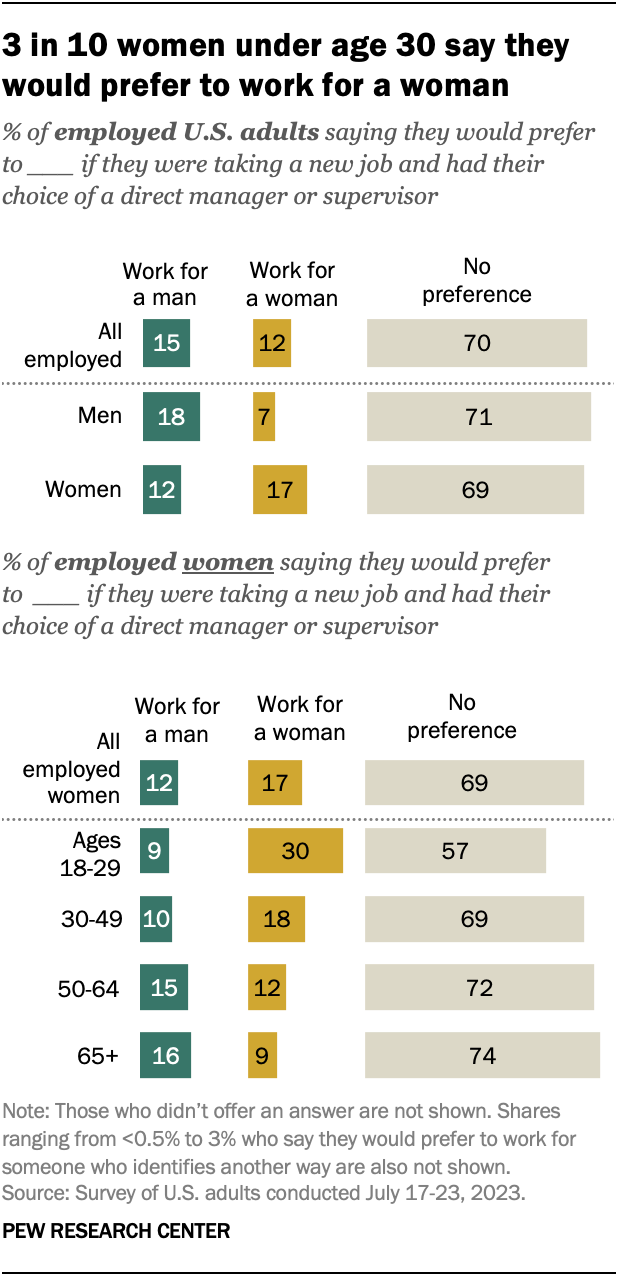
Seven-in-ten workers say they do not have a gender preference. But 15% would prefer to work for a man, 12% for a woman and 2% for someone who identifies another way.
And when workers do have a preference, it tends to be for a boss who is the same gender as they are:
- More men say they would prefer to work for a man than for a woman (18% vs. 7%).
- To a lesser degree, more women say they would prefer to work for a woman than for a man (17% vs. 12%).
Young women are especially likely to prefer to work for a boss who is a woman. Three-in-ten employed women under age 30 say they would prefer this. Smaller shares of employed women ages 30 and older and employed men of any age say the same.
Note: Here are the questions used for this analysis, along with responses, and the survey methodology.


