Nearly 23 million Americans get health insurance through one of the online “exchanges” (also called “marketplaces”) that operate under the 2010 Affordable Care Act, or ACA. Most receive subsidies from the federal government to lower their premiums and out-of-pocket costs.
In 2021, Congress enhanced the law’s original subsidies and extended them to more people. But those changes expired at the end of 2025, meaning that millions of people now face higher insurance costs. The nonpartisan Congressional Budget Office estimates that 4.2 million more people will be uninsured by 2034 as a direct result of Congress not extending the enhanced subsidies.
The ACA made many changes to the U.S. health care system, from expanding Medicaid eligibility to prohibiting insurers from denying coverage based on preexisting conditions. But in many ways, the exchanges are the heart of the law. Here are answers to some common questions about the exchanges and how they work.
What exactly is an ACA exchange?
Exchanges are online platforms where people can compare and buy different health insurance plans offered by private insurers. In 28 states, the federal government operates the exchanges under the common name HealthCare.gov; 22 states and the District of Columbia run their own exchanges. (There are separate exchanges for individuals and small businesses, but this analysis focuses on the individual ones, which are far more widely used.)
Congress created the exchanges to serve people who don’t qualify for Medicaid or other public insurance (because they make too much money, don’t meet residency requirements or another reason) and don’t have access to affordable, employer-sponsored insurance.
People can shop for insurance during the open enrollment period, which typically runs from November through mid-January. People who experience certain life events – such as moving, getting married, losing a job or having a baby – may also be able to enroll at other times of the year.
How many people use the exchanges?
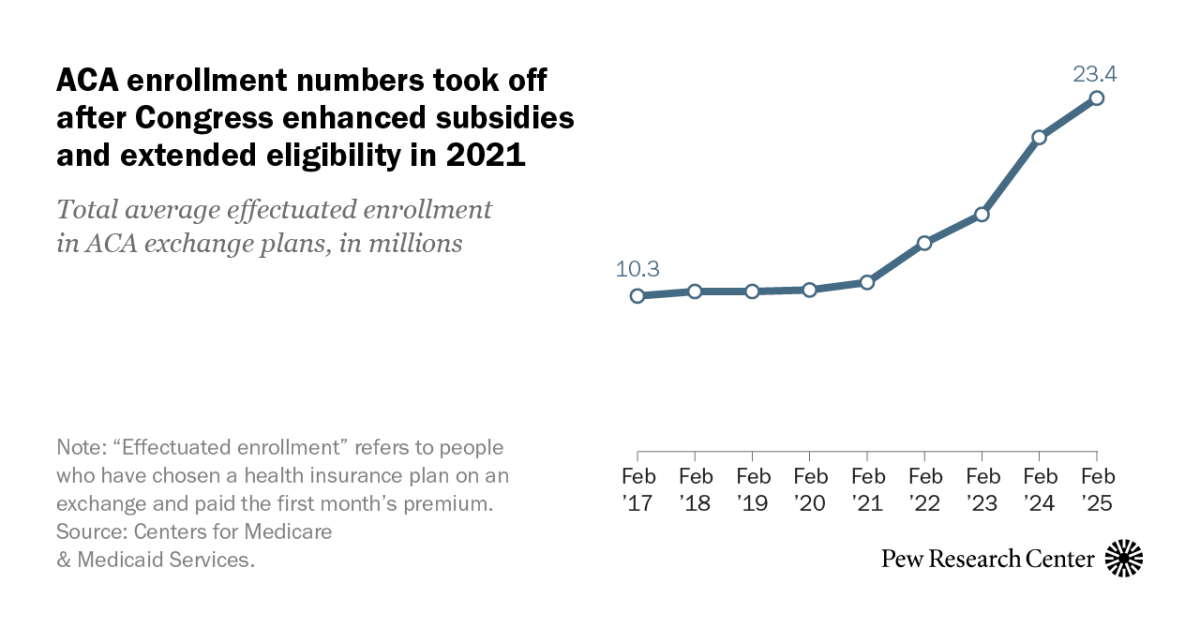
ACA enrollment numbers took off after Congress enhanced subsidies and extended eligibility in 2021
Total average effectuated enrollment in ACA exchange plans, in millions
Note: “Effectuated enrollment” refers to people who have chosen a health insurance plan on an exchange and paid the first month’s premium.
Source: Centers for Medicare & Medicaid Services.
PEW RESEARCH CENTER
ACA enrollment numbers took off after Congress enhanced subsidies and extended eligibility in 2021
Total average effectuated enrollment in ACA exchange plans, in millions
| Date | Enrollment (millions) |
|---|---|
| 02/01/2017 | 10.3 |
| 02/01/2018 | 10.6 |
| 02/01/2019 | 10.6 |
| 02/01/2020 | 10.7 |
| 02/01/2021 | 11.2 |
| 02/01/2022 | 13.8 |
| 02/01/2023 | 15.7 |
| 02/01/2024 | 20.8 |
| 02/01/2025 | 23.4 |
Note: “Effectuated enrollment” refers to people who have chosen a health insurance plan on an exchange and paid the first month’s premium.
Source: Centers for Medicare & Medicaid Services.
PEW RESEARCH CENTER
About 22.8 million people selected a plan from either the federal exchange or a state-run exchange during the open enrollment period for 2026, compared with 24.3 million who did so a year earlier. In previous years, more than 95% of people who chose a plan officially enrolled in one, by paying the first month’s premium. For example, in 2025 about 23.4 million people did so.
Before the start of the COVID-19 pandemic, enrollment via the exchanges plateaued at around 10.5 million people. But it surged after Congress enhanced the premium subsidies in 2021.
Still, only about 6.9% of the total U.S. population buys health insurance through the ACA exchanges. By contrast, 64.4 million Americans (19.1% of the population) were covered by Medicare in 2024, the most recent year for which data is available, and 59.4 million were covered by Medicaid (17.6%).
Related: What the data says about Medicaid
What kind of health insurance plans are available on the exchanges?
All plans sold on ACA exchanges have to cover a set of “essential health benefits,” though the precise services vary by state.
As in the regular insurance market, exchange plans can have different premiums, deductibles, copayments, covered services and reimbursement rates. To help consumers sort through all that, exchange plans are sorted into four tiers, based on how much of patients’ covered health care costs they pay on average (that is, not for any specific customer or claim):
- Platinum: 90% of costs covered, on average
- Gold: 80%
- Silver: 70% (or possibly more depending on income)
- Bronze: 60%
In general, Platinum and Gold plans have the highest premiums and lowest deductibles, while Bronze plans have the lowest premiums and highest deductibles. There also are “Catastrophic” plans, with very low premiums and very high deductibles, but they’re only available to certain people. Fewer than 1% of exchange customers opt for Catastrophic plans.
In some cases, people who choose Silver plans – but no others – can get extra federal subsidies that lower their copayments and other out-of-pocket costs. Those subsidies, which are known as “cost-sharing reductions” and vary depending on income, can raise Silver plans’ payout shares to as much as 96%.
Perhaps for that reason, Silver plans are by far the most popular. More than half (56%) of all plans selected on all exchanges during the pre-2025 open enrollment period were Silver, according to the Center for Medicare & Medicaid Services, the federal agency that oversees the exchanges.
How do federal subsidies under the ACA work?
Besides the cost sharing reductions mentioned above, the main subsidy under the ACA is the “premium tax credit,” or PTC. Though structured as an income tax credit, the practical effect of the PTC is to reduce insurance premiums.
ACA premium subsidies have become more generous in recent years
Average monthly advance premium tax credit, for exchange customers receiving them
Source: Centers for Medicare & Medicaid Services.
PEW RESEARCH CENTER
ACA premium subsidies have become more generous in recent years
Average monthly advance premium tax credit, for exchange customers receiving them
| Year | Average APTC |
|---|---|
| 2016 | $290.08 |
| 2017 | $373.06 |
| 2018 | $517.61 |
| 2019 | $512.11 |
| 2020 | $492.73 |
| 2021 | $508.73 |
| 2022 | $504.13 |
| 2023 | $519.56 |
| 2024 | $527.64 |
Source: Centers for Medicare & Medicaid Services.
PEW RESEARCH CENTER
The dollar amount of the PTC depends on both a buyer’s income and how much insurance costs in their marketplace area. It’s calculated by subtracting the buyer’s “required contribution” from the actual cost of the second cheapest Silver plan (called the “benchmark” plan) available on their exchange. The required contribution, in turn, is a percentage of the buyer’s income, which rises as income does.
Although the PTC is based on the benchmark plan, exchange customers can use it to buy any available plan. And unlike most tax credits, the PTC can be taken in advance in monthly chunks – allowing it to reduce a person’s monthly premium. The PTC, like other tax credits, also can be claimed in full at tax time, but few people go that route. As of February 2025, more than 93% of all enrollees took the advance credit.
What were the enhanced subsidies that expired at the end of 2025?
Expiration of enhanced ACA subsidies means many Americans will spend more on health insurance
Income share of “required minimum contribution” toward insurance premiums
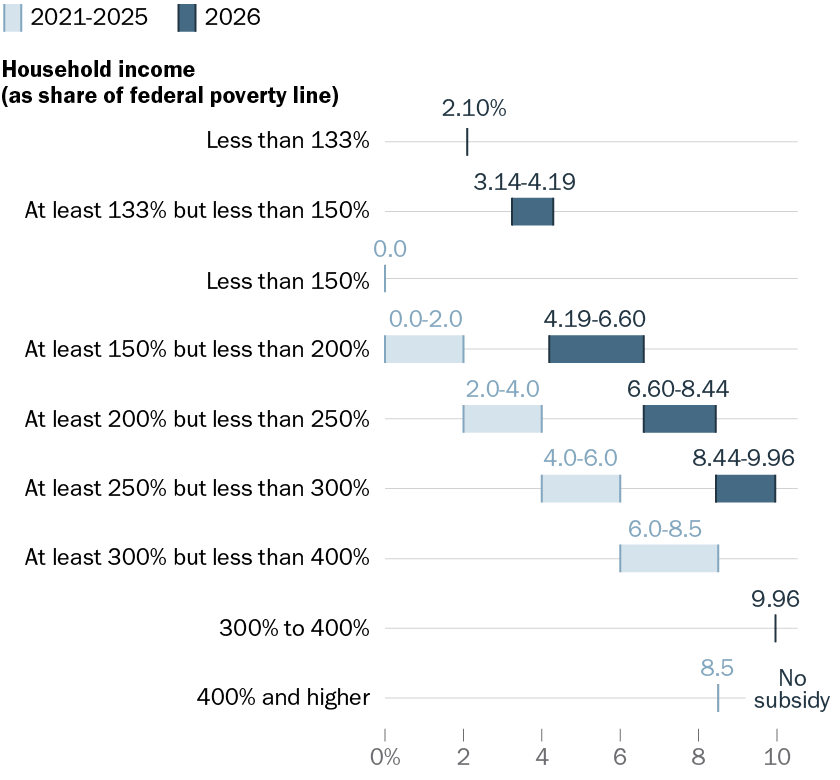
Source: IRS.
PEW RESEARCH CENTER
Expiration of enhanced ACA subsidies means many Americans will spend more on health insurance
Income share of “required minimum contribution” toward insurance premiums
| Household income (as share of federal poverty line) | 2021-25 | 2026 |
|---|---|---|
| Less than 133% | 2.10% | |
| At least 133% but less than 150% | 3.14%-4.19% | |
| Less than 150% | 0.00% | |
| At least 150% but less than 200% | 0.0%-2.0% | 4.19%-6.60% |
| At least 200% but less than 250% | 2.0%-4.0% | 6.60%-8.44% |
| At least 250% but less than 300% | 4.0%-6.0% | 8.44%-9.96% |
| At least 300% but less than 400% | 6.0%-8.5% | |
| 300% to 400% | 9.96% | |
| 400% and higher | 8.5% | No subsidy |
Source: IRS.
PEW RESEARCH CENTER
In 2021, Congress made the premium tax credits more generous and made more people eligible for them. Before these changes, the required contribution percentages ranged from 2.07% to 9.86% of income. Afterward, they ranged from zero percent to 8.5%. The law also extended subsidies to people whose income exceeded 400% of the federal poverty level (which itself varies by household type). Previously, 400% was the upper limit.
At first, those enhancements were only in place for 2021 and 2022. A later law extended them to the end of 2025. Extending them further was a key Democratic demand during last year’s record-long government shutdown. As of Jan. 21, Congress has not agreed on a deal to extend the enhanced subsidies, leaving the original ones in effect.
How much of a difference did the enhanced subsidies make?
As of February 2025, the advance premium tax credit, or APTC, shaved 83% off the average monthly premium. Before the subsidies were enhanced in 2021, the APTC cut roughly three-quarters of the monthly cost. But the impact can vary considerably among buyers in different circumstances.
To get a sense of that variability, we used the ACA Enhanced Premium Tax Credit Calculator from KFF, a nonpartisan research organization focused on health policy, to estimate the impact of the enhanced subsidies on households of varying compositions and income levels around the country. (The estimates were made in mid-December, before the enhancements expired.) Overall, KFF estimates suggest that the enhancements benefited people of moderate incomes the most.
For example, a family of five in south-central Idaho making $100,000 a year would pay $385 a month for a Silver plan with the enhancements, but $743 a month without them. A family of four making $150,000 annually in the Orlando, Florida, area would see its monthly insurance bill rise from $1,063 to $1,880 without enhancements. And the premium for a couple making $200,000 a year in San Luis Obispo County, California, would nearly double, from $1,417 to $2,733 a month.
How much will losing enhanced Affordable Care Act subsidies cost people? It depends on who they are and where they live
Monthly cost for a Silver plan under the Affordable Care Act
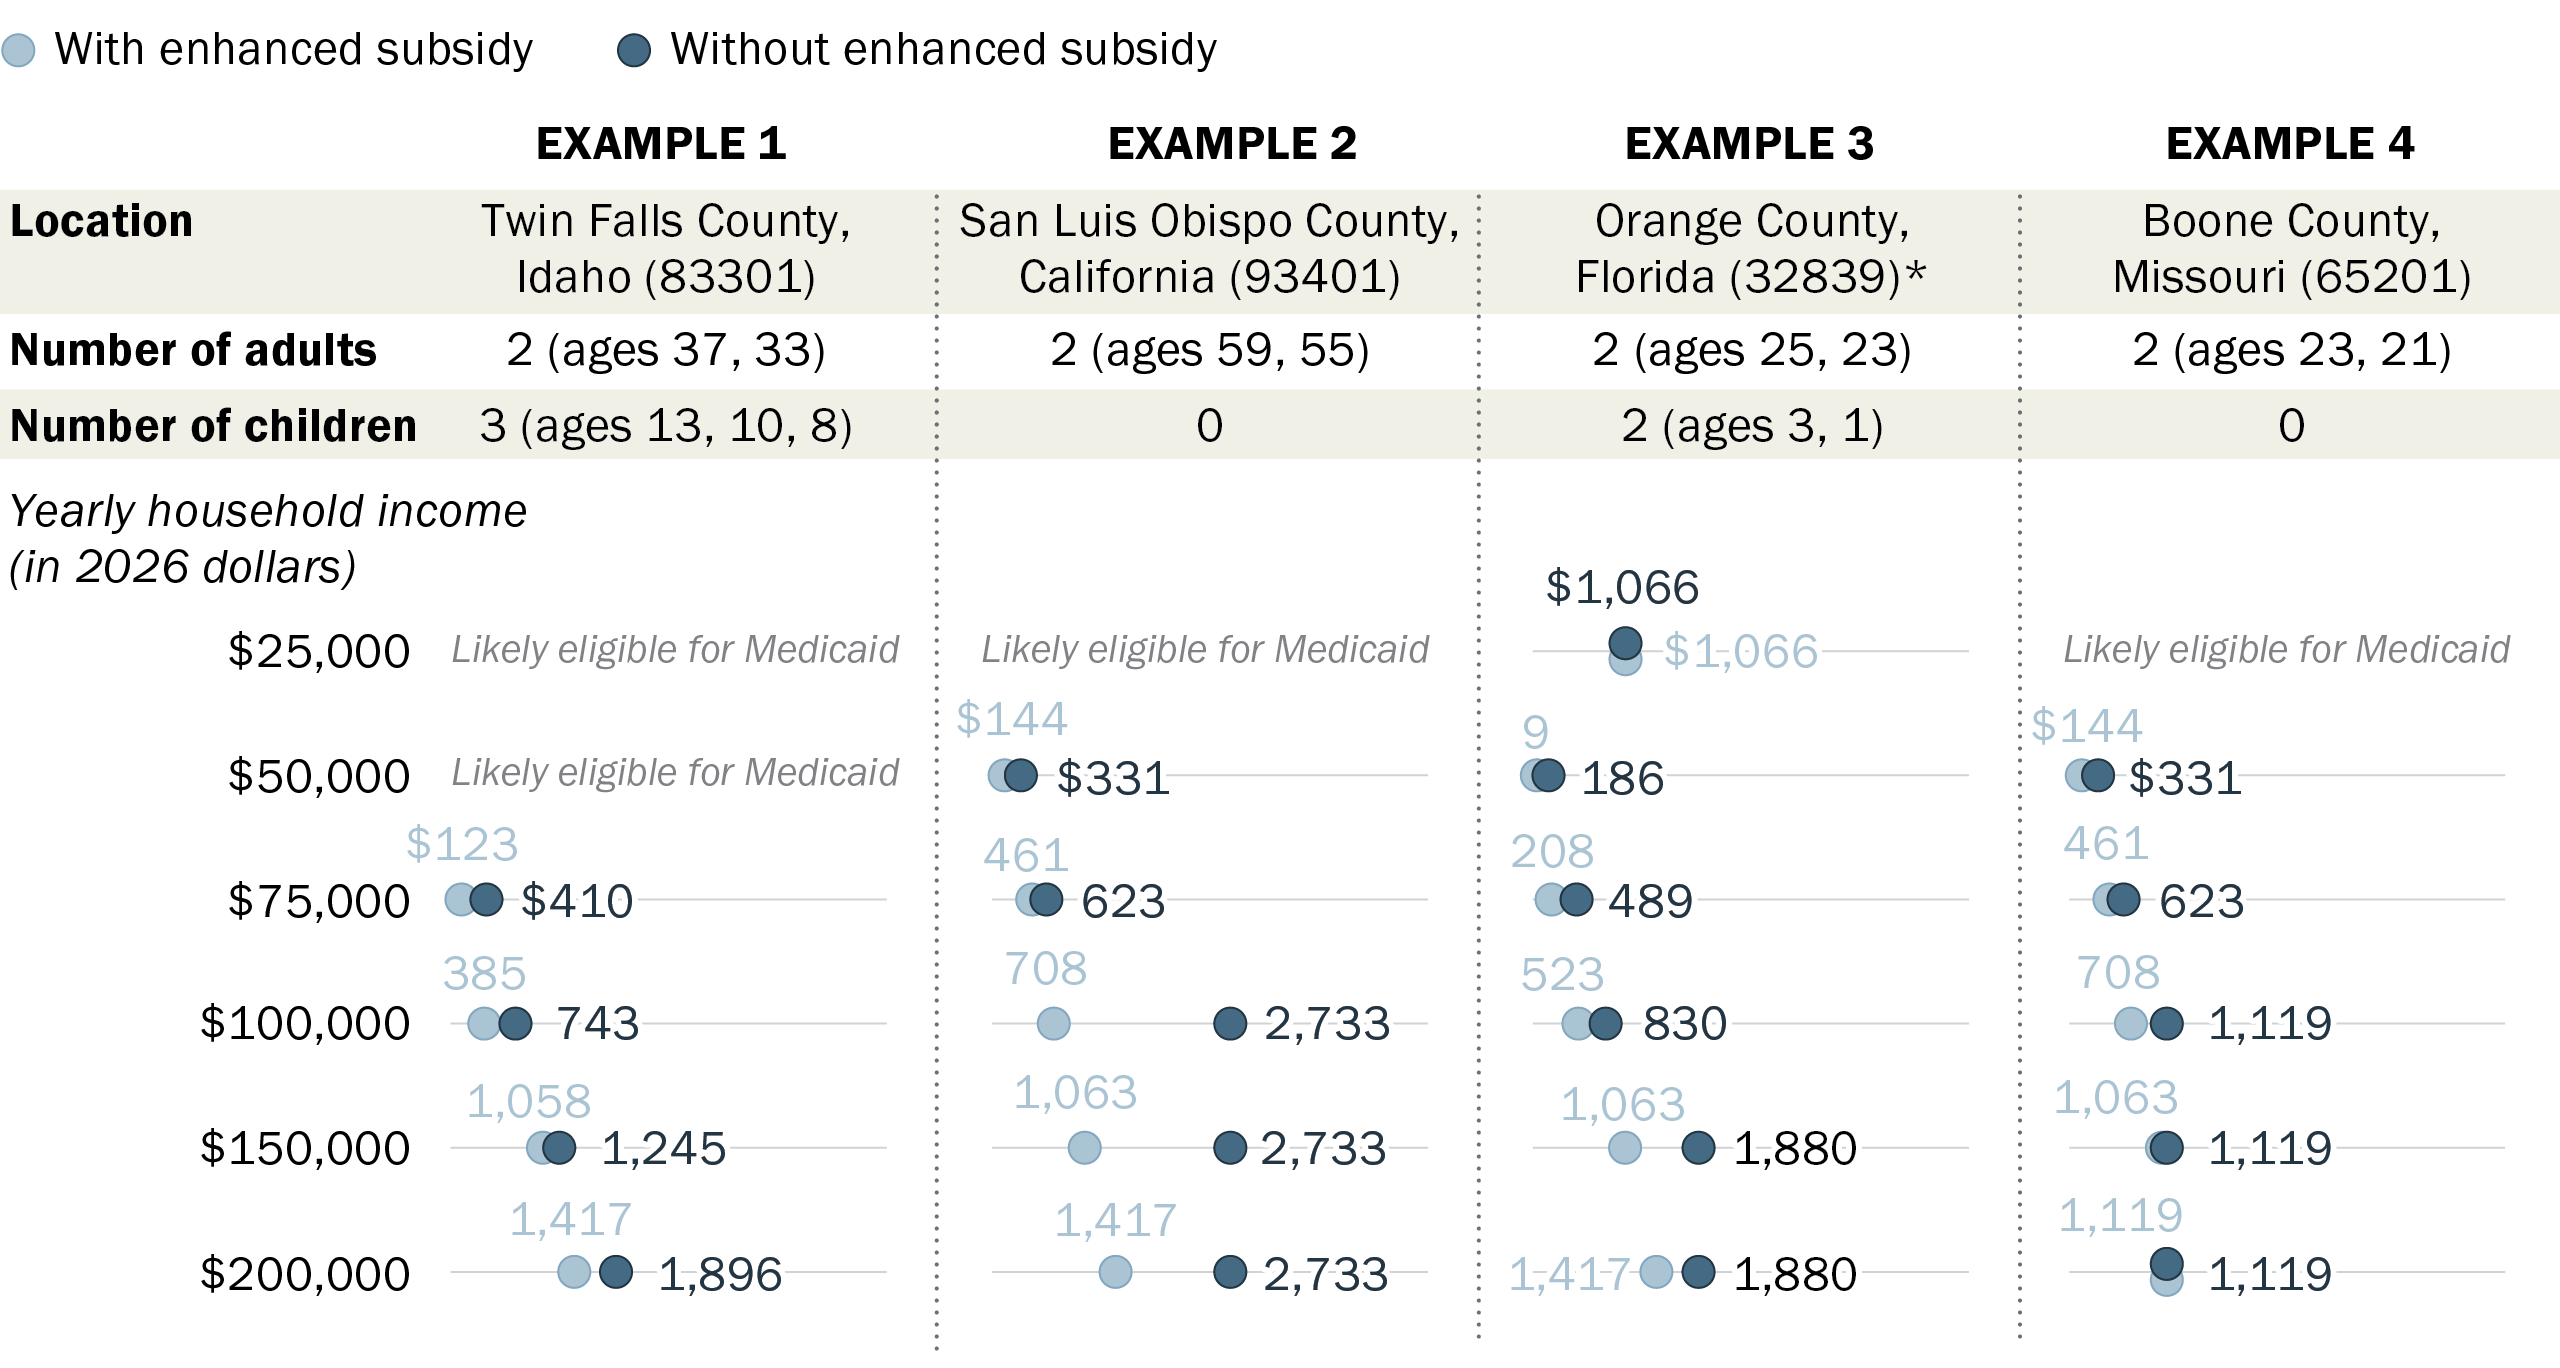
* In this scenario, at the $25,000 household income level, the adults would not be eligible for either Medicaid or financial assistance through the Affordable Care Act. The children likely would be eligible for Medicaid or Children’s Health Insurance Program at the $25,000 and $50,000 household income levels, and so are excluded from those estimates.
Source: Pew Research Center analysis using KFF’s ACA Enhanced Premium Tax Credit Calculator.
PEW RESEARCH CENTER
How much will losing enhanced Affordable Care Act subsidies cost people? It depends on who they are and where they live
Monthly cost for a Silver plan under the Affordable Care Act
| Example Scenarios | Monthly cost with enhanced premium tax credit | Monthly cost without enhanced premium tax credit |
|---|---|---|
| EXAMPLE 1: | ||
| Location: | Twin Falls County, Idaho | |
| # of adults: | 2 (ages 37, 33) | |
| # of children: | 3 (ages 13, 10, 8) | |
| Yearly household income (in 2026 dollars) | With enhanced premium tax credit | Without enhanced premium tax credit |
| $25,000 | Likely eligible for Medicaid | Likely eligible for Medicaid |
| $50,000 | Likely eligible for Medicaid | Likely eligible for Medicaid |
| $75,000 | $123 | $410 |
| $100,000 | $385 | $743 |
| $150,000 | $1,058 | $1,245 |
| $200,000 | $1,417 | $1,896 |
| EXAMPLE 2: | ||
| Location: | San Luis Obispo County, California | |
| # of adults: | 2 (ages 59, 55) | |
| # of children: | 0 | |
| Yearly household income (in 2026 dollars) | With enhanced premium tax credit | Without enhanced premium tax credit |
| $25,000 | Likely eligible for Medicaid | Likely eligible for Medicaid |
| $50,000 | $144 | $331 |
| $75,000 | $461 | $623 |
| $100,000 | $708 | $2,733 |
| $150,000 | $1,063 | $2,733 |
| $200,000 | $1,417 | $2,733 |
| EXAMPLE 3: | ||
| Location: | Orange County, Florida* | |
| # of adults: | 2 (ages 25, 23) | |
| # of children: | 2 (ages 3, 1) | |
| Yearly household income (in 2026 dollars) | With enhanced premium tax credit | Without enhanced premium tax credit |
| $25,000 | $1,066 | $1,066 |
| $50,000 | $9 | $186 |
| $75,000 | $208 | $489 |
| $100,000 | $523 | $830 |
| $150,000 | $1,063 | $1,880 |
| $200,000 | $1,417 | $1,880 |
| EXAMPLE 4: | ||
| Location: | Boone County, Missouri | |
| # of adults: | 2 (ages 23, 21) | |
| # of children: | 0 | |
| Yearly household income (in 2026 dollars) | With enhanced premium tax credit | Without enhanced premium tax credit |
| $25,000 | Likely eligible for Medicaid | Likely eligible for Medicaid |
| $50,000 | $144 | $331 |
| $75,000 | $461 | $623 |
| $100,000 | $708 | $1,119 |
| $150,000 | $1,063 | $1,119 |
| $200,000 | $1,119 | $1,119 |
* In this scenario, at the $25,000 household income level, the adults would not be eligible for either Medicaid or financial assistance through the Affordable Care Act. The children likely would be eligible for Medicaid or Children’s Health Insurance Program at the $25,000 and $50,000 household income levels, and so are excluded from those estimates.
Source: Pew Research Center analysis using KFF’s ACA Enhanced Premium Tax Credit Calculator.
PEW RESEARCH CENTER
How many people receive subsidies under the ACA?
As of February 2025, 21.8 million enrollees took the advance premium tax credit (APTC) subsidy (93.3% of enrollees), and 12.5 million (53.5%) received the cost-sharing reductions.
These percentages are higher than in February 2020 – before Congress expanded the subsidies – when 86.5% of enrollees received the advance PTC, and 50.1% received cost-sharing reductions.
But some critics say the PTC program is rife with fraud, citing that as a reason to let the enhancements expire.
The Centers for Medicare & Medicaid Services has reported that it made $925.7 million in improper subsidy payments in 2022 – about 1.6% of all the PTC subsidies it paid that year. Last year two Florida insurance brokers were convicted of enrolling ineligible people, collecting millions of dollars in fraudulent commissions. And a recent report by the Government Accountability Office found weaknesses in CMS’s systems for preventing fraud, such that auditors were able to enroll fictitious people with incomplete or missing information.
How much does the federal government spend on ACA subsidies?
The exact amount the government spends on subsidies depends on who’s counting and how they’re doing it, but it’s a considerable sum any way you look at it: