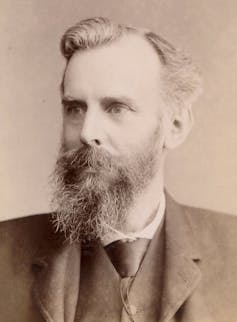
April 2023 marks the 100th anniversary of the death of mathematician and philosopher John Venn. You may well be familiar with Venn diagrams – the ubiquitous pictures of typically two or three intersecting circles, illustrating the relationships between two or three collections of things.
For example, during the pandemic, Venn diagrams helped to illustrate symptoms of COVID-19 that are distinct from seasonal allergies. They are also often taught to school children and are typically part of the early curriculum for logic and databases in higher education.

wikipedia, CC BY-SA
Venn was born in Hull, UK, in 1834. His early life in Hull was influenced by his father, an Anglican priest – it was expected John would follow in his footstep. He did initially begin a career in the Anglican church, but later moved into academia at the University of Cambridge.
One of Venn’s major achievements was to find a way to visualise a mathematical area called set theory. Set theory is an area of mathematics which can help to formally describe properties of collections of objects.
For example, we could have a set of cars, C. Within this set, there could be subsets such as the set of electric cars, E, the set of petrol based cars, say P, and the set of diesel powered cars, D. Given these, we can operate on them, for example, to apply car charges to the sets P and D, and a discount to the set E.
These sorts of operations form the basis of databases, as well as being used in many fundamental areas of science. Other major works of Venn’s include probability theory and symbolic logic. Venn had initially used diagrams developed by the Swiss mathematician Leonard Euler to show some relationships between sets, which he then developed into his famous Venn diagrams.
Venn used the diagrams to prove a form of logical statement known as a categorical syllogism. This can be used to model reasoning. Here’s an example: “All computers need power. All AI systems are computers.” We can chain these together to the conclusion that “all AI systems need power”.
Today, we are familiar with such reasoning to illustrate how different collections relate to each other. For example, the SmartArt tool in Microsoft products lets you create a Venn diagram to illustrate the relationships between different sets. In our earlier car example, we could have a diagram showing electric cars, E, and petrol powered cars, P. The set of hybrid cars that have a petrol engine would be in the intersection of P and E.
Logic and computing
The visualisation of sets (and databases) is helpful, but the importance of Venn’s work then – and now – is the way they allowed proof of George Boole’s ideas of logic as a formal science.
Venn used his diagrams to illustrate and explore such “symbolic logic” – defending and extending it. Symbolic logic underpins modern computing, and Boolean logic is a key part of the design of modern computer systems – making his work relevant today.
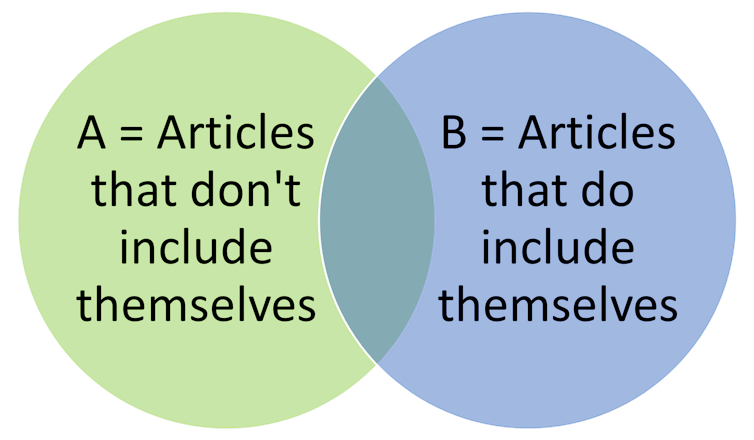
Venn’s work was also crucial to the work of philosopher Bertrand Russell, showing that there are problems that are unsolvable. We can express such problems with sets, in which each is an unsolvable problem. One such unsolvable problem can be expressed with the “Barber paradox”. Suppose we had an article in Wikipedia containing all the articles that don’t contain themselves – a set. Is this new article itself in that set?
Luckily we can visualise that with a Venn diagram with two circles, where one circle is the set of entries that don’t include themselves, A, and the other circle is the set of entries that do include themselves, B.
We can then ask the question: where do we put the article that contains all the articles that don’t contain themselves? Have a think about it, then see where you would put it.

The problem is that it cannot be on the left, as it would contain itself, and would therefore be inconsistent. And it cannot be on the right, as then it would be missing, or incomplete. And it can’t be in both. It must be in one or the other. This paradox illustrates how unsolvable statements can arise – they are valid in terms of expressing them within the logical system, but ultimately unanswerable. We could possibly extend our system to solve this, but then we would end up with another unanswerable question.
Venn’s diagrams were crucial in understanding this. And this area of science is still important, for example when considering the limitations of machine learning and AI, where we may ask questions that cannot be answered.
Venn also had an interest in building mechanical machines – including a bowling machine which proved so effective it was able to bowl out some top Australian batsmen of the day.
Following his abstract work on logic, he developed the concept of a logical-diagram machine with a lot of processing power: though this brilliant idea from 1881 would take many decades to appear as modern computers.
We remember Venn here in Hull, with a bridge close to his birthplace decorated with Venn circle inspired artwork. At the University of Hull’s main administration building, there’s an intersection of management and academia which is called the Venn building.


